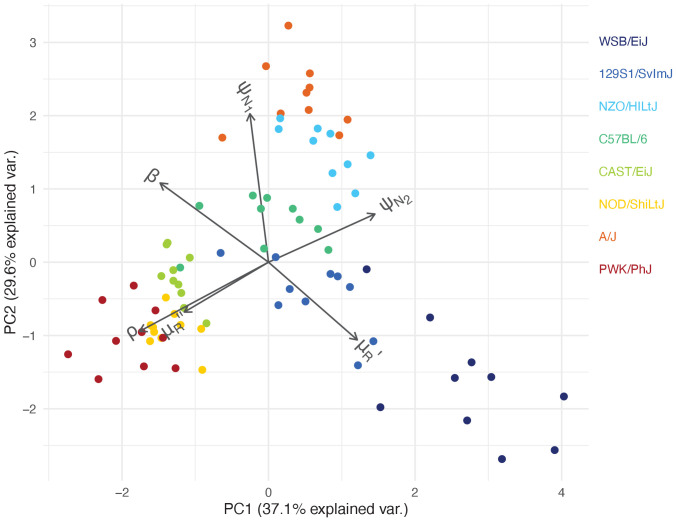
Figure 5. Within-host ecological parameters differentiate mouse strains with varying degrees of resilience to malaria infection.
The PCA biplot displays the relationship between individual mice in the first two principal components, which collectively account for 66.7% of the total variance in parameters describing within-host malaria ecology, . The direction and length of the grey arrows indicate the contribution of each parameter to the principal components. Parameter descriptions are found in Table 1.

