. 2021 Sep 6;10:e69377. doi: 10.7554/eLife.69377

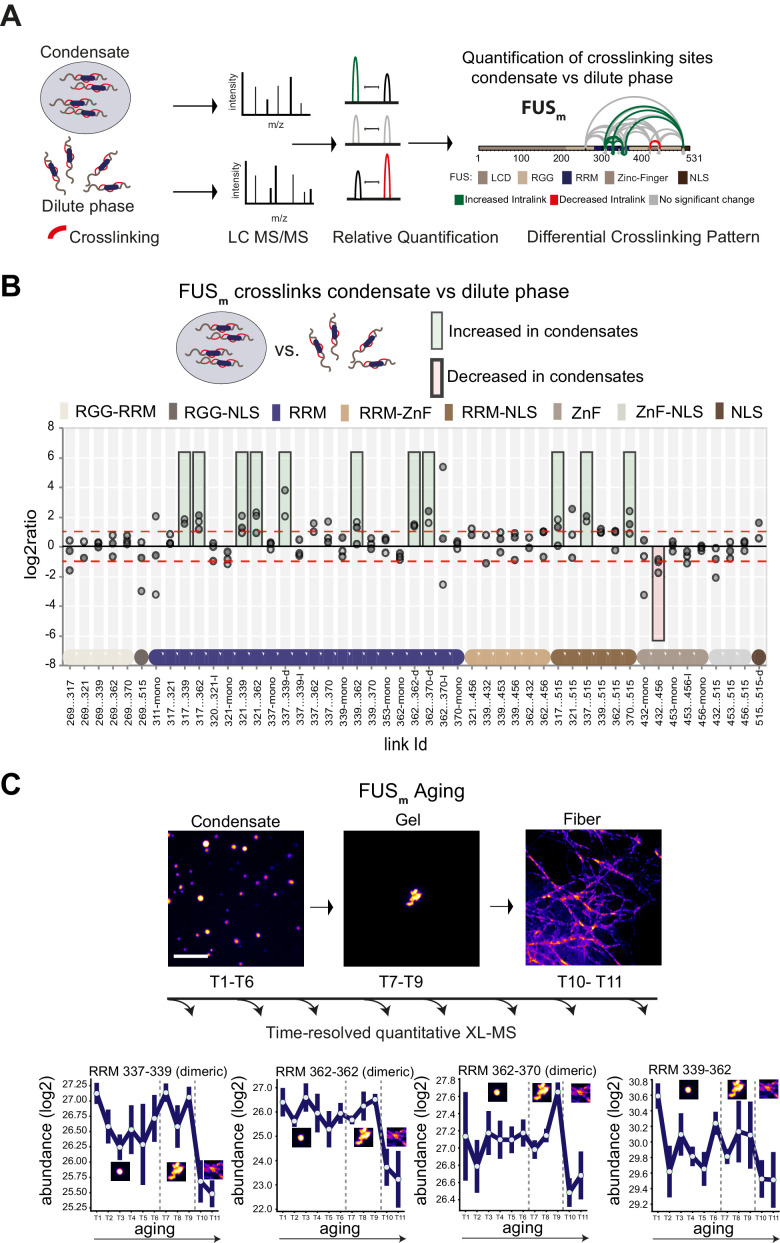
Figure 1. Domain-specific changes in crosslink abundances underlying condensate formation and molecular aging.

(A) Workflow of quantitative crosslinking coupled to mass spectrometry (qXL-MS) of FUSm condensates. (B) Crosslink abundance plot from reconstituted FUSm condensates. Plotted are the relative enrichment (droplet vs. non-droplet) for each unique crosslinking site (y-axis) sorted according to the known domain structure within FUSm (x-axis). Shown are only high confidence crosslinking sites (see Materials and methods for details) from three biologically independent sets of experiments (n=3; circles in different shades of gray). Please note that FUSm used throughout this manuscript contains both a C-terminal GFP used for visualization and a 5 AA N-terminal tag used for purification. All uxIDs therefore have an offset of 5 AA compared to the UniProt entry for human FUS (P35637). Crosslinking sites that were consistently upregulated or downregulated twofold or more (log2ratio≥1 or ≤−1 and FDR≤0.05) in at least two out of three biological replicate sets and in addition contained no opposing regulation in any replicate set were considered significant and are highlighted with a green (enriched in droplets) or red background rectangle (decreased in droplets). All other changes in crosslinking abundances were considered insignificant and are shown on gray background. The significance threshold of twofold enrichment is indicated as dashed red line. Dimeric links are indicated by an additional ‘−d’, loop-links by a ‘−l’ and mono-links by an ‘-mono’ at their respective unique crosslinking site. Domain structures within FUSm are color-coded as in (A). RGG refers to AAs 220–289. (C) Upper panel: workflow time-resolved quantitative XL-MS. The conversion of fresh FUSm condensates via the gel state into fibers was monitored by fluorescence microscopy. Scale bar is 10 µm. At indicated time points, aliquots of the stock solution were crosslinked for 5 min, flash-frozen in liquid nitrogen, and subsequently analyzed by MS (see Materials and methods for details). Lower panel: shown are changes of RRM crosslinks during aging that were increased during condensation (B). The logarithmic total MS1 area for each time point during aging is plotted (SDs; n=6). Domain structures within FUSm are color-coded as in (A). RRM, RNA recognition motif.

Figure 1.

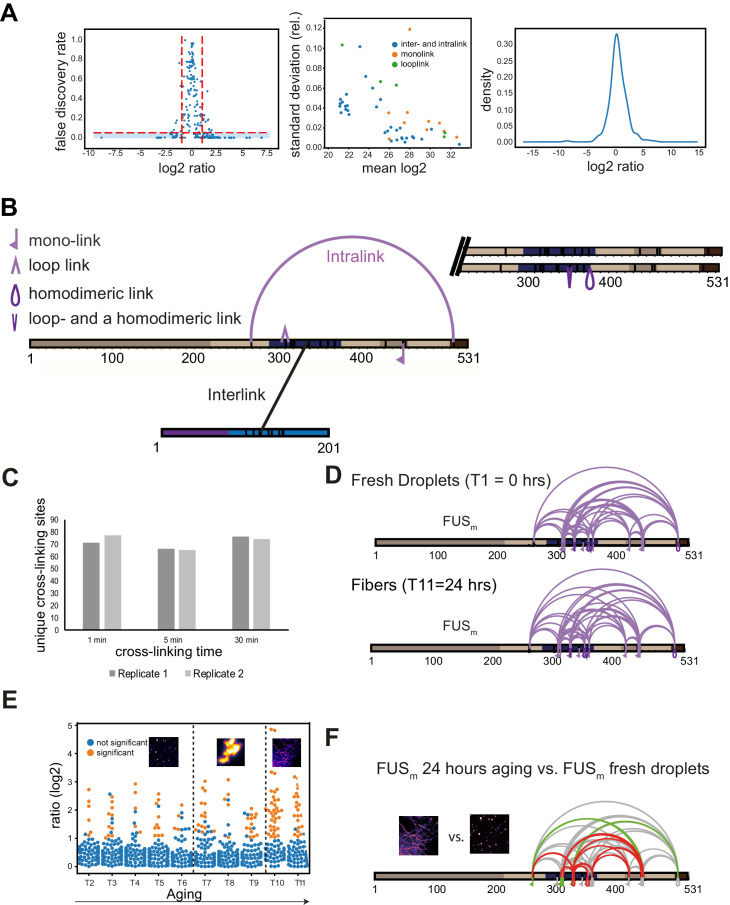
Figure 1—figure supplement 1. Quantitative and time-resolved XL-MS reveal domain-specific changes in crosslink abundances underlying condensate formation.

Figure 1—figure supplement 1.

(A) Statistical validation of crosslinking data. Left panel shows the relationship between the log2ratio and FDR for qXL-MS data. FDR values are p-values corrected for multiple testing (see Materials and methods for details). Significant crosslinks are shown in the blue-shaded area (log2ratio≥1 or ≤−1 and FDR≤0.05). The majority of crosslinks with a high FDR value are found between the log2ratios of −1 and +1. The middle panel shows that quantifications are highly reproducible within triplicate measurements. Plotted is the absolute mean MS1 peak area per crosslink and experiment in log2-scale (where the mean is made up of the light and heavy state and the biological replicates of a crosslink) (x-axis) versus the relative standard deviation of the mean (y-axis). It increases with a decreasing mean but remains below 10% for virtually all crosslinks. The right panel shows that the overall distribution of log2ratios is centered around 0, confirming that the data has no systematic bias. (B) Disuccinimidyl suberate (DSS) was used to introduce covalent bonds between proximal primary amines in order to link lysine residues within studied proteins. The actual crosslinking sites are subsequently identified by MS and reflect the spatial proximity of regions and protein-domains within a given protein (intra-link) or between different proteins (inter-link). Additionally, the crosslinker can react twice within one peptide (loop-link) or only on one side with the protein and hydrolyze on the other side (mono-link), revealing information on the accessibility of a specific lysine residue. XL-MS cannot readily discriminate if a crosslink has formed within one polypeptide chain (defined as intra-link, vide supra) or between homodimers or even higher oligomers of the same protein. This is usually not a problem, but in the case of the high protein concentrations within condensates it may play a role. However, as we detect all shown intra-links within FUSm and HspB8 also under the relatively low-concentration regime of the dilute phase, it is fair to assume that all of the links are indeed intra-links as usually defined—for example occurring within one FUSm polypeptide chain—as we assume in the current version of the manuscript. For some specific intra-links, we do however know that they must have occurred between different molecules of the same protein; these are crosslinks between overlapping peptides whose sequence is unique within the protein and that must therefore originate from different copies of the same protein (homo-dimeric link). (C) Significantly shorter crosslinking time periods than conventionally used lead to reproducible and sufficient crosslinking yields. A test protein was crosslinked for different time periods (1 min, 5 min, and the standard 30 min) before the reaction was quenched and crosslinks were identified by LC-MS/MS (data for two biological replicates are shown). In order to minimize the induced error rate due to sample handling, a crosslinking period of 5 min was chosen for all time points. (D) Crosslinks of FUSm from fresh droplets (T1=0 hr) (upper panel) and the final fiber state (T11=24 hr) (lower panel) reveal a similar overall crosslinking pattern. Experiments were carried out in triplicates and crosslinks were only considered, if they were identified in two out of three replicates with a deltaS<0.95, a minimum Id score≥20, and an ld score≥25 in at least one replicate (filtering was done on the level of the unique crosslinking site) and an FDR<0.05. (E) Overview plot of all crosslinks consistently quantified over 11 time points during the aging process. Crosslinks with a significant change relative to fresh condensates (T1) (log2ratio≥1 or ≤−1 and FDR≤0.05) were colored orange while non-significantly changed crosslinks were colored blue. (F) Comparison of the overall differential crosslinking pattern from FUSm from the final fiber state (T11=24 hr) versus fresh droplets (T1=0 hr). Crosslinking sites that were upregulated or downregulated twofold or more (log2ratio≥±1.0 and FDR≤0.05) were considered significant and are highlighted in green (i.e., relative enrichment in final fiber state) or red (i.e., relative decrease in final fiber state). All other changes in crosslinking abundances were considered insignificant and are shown in gray background.