. 2021 Sep 6;10:e69377. doi: 10.7554/eLife.69377

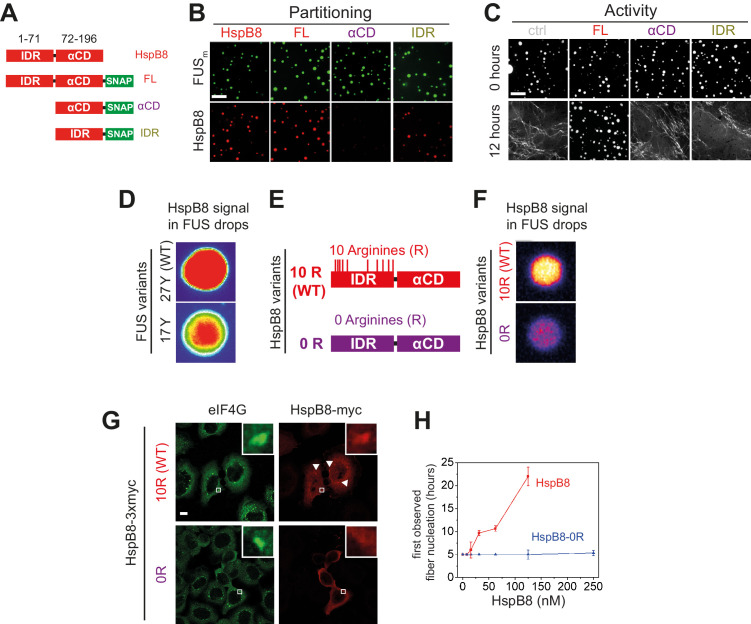
Figure 4. Arginines within the disordered region of HspB8 direct the α-crystallin domain into FUS condensates for chaperoning.

(A) Overview of HspB8 truncation variants used in this study. FL (full-length HspB8 fused to a SNAP-tag), αCD (HspB8 alpha-crystallin domain [AA72–196] fused to a SNAP-tag), and IDR (HspB8-N-terminus [AA1–71] fused to a SNAP-tag). (B) Partitioning of 5 µM HspB8 SNAP constructs (1:20 mix of labeled:unlabeled) into 5 µM FUSm condensates. Scale bar is 10 µm. (C) Aging assay of 5 µM FUSm condensates in the absence (ctrl) and presence of 5 µM HspB8 truncation variants. Scale bar is 10 µm. (D) Partitioning of 5 µM HspB8 (1:20 mix of labeled:unlabeled) into condensates formed by 5 µM FUS wildtype (27 Y, WT) or a variant with a reduced number of tyrosines in its IDR (17 Y). (E) Location of Arg residues in the primary structure of HspB8. 10 Arg residues are located in the N-terminus of HspB8-WT (10 R). In the HspB8-0R variant, these Arg residues are replaced by Gly residues (0 R). (F) Partitioning of 5 µM HspB8-WT or HspB8-0R variant (1:20 mix of labeled:unlabeled) into condensates formed by 5 µM FUSm. (G) HeLa Kyoto cells expressing HSPB8-WT-3xmyc or HSPB8-0R-3xmyc from a plasmid were subjected to heat shock at 43.5°C for 1 hr. Cells were fixed and stained with myc and eIF4G specific antibodies. Merged image composed of eIF4G (green) and myc (red) signals is shown. (H) The onset of 5 µM FUSm fiber formation as a function of HspB8-0R concentration. IDR, intrinsically disordered region.

Figure 4.

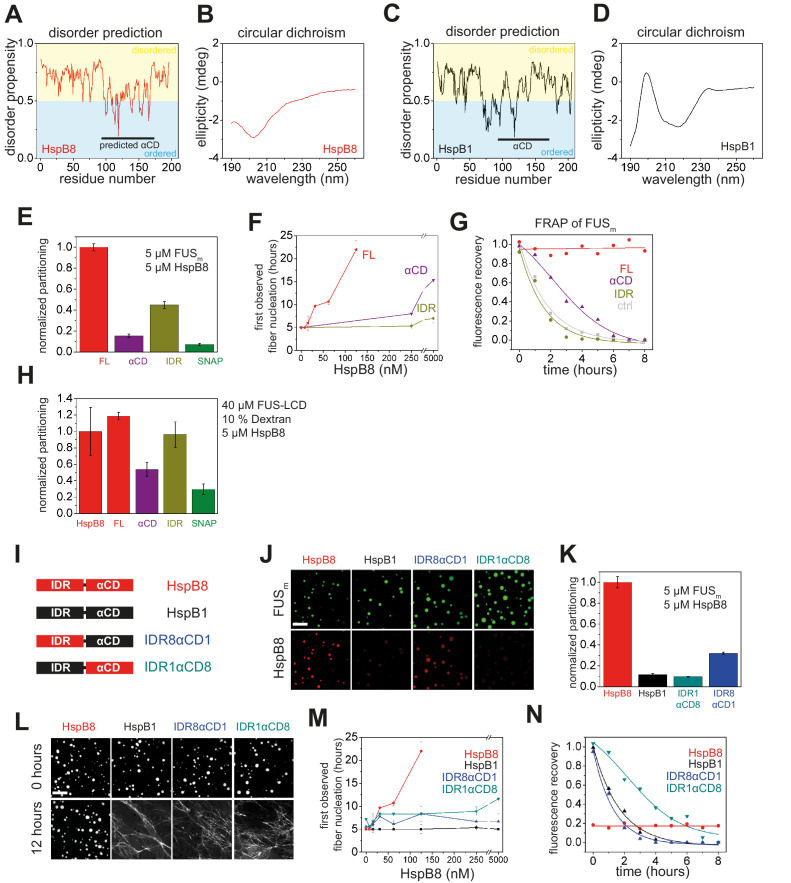
Figure 4—figure supplement 1. Arginines in the disordered region of HspB8 direct the αCD into FUS condensates.

Figure 4—figure supplement 1.

(A–D) Disorder prediction and circular dichroism of HspB8 and closely related HspB1. (A) Disorder prediction plot using Dis-EMBL1.5 (Linding et al., 2003) for HspB8 shows that except for the αCD a large portion of the chaperone is predicted to be disordered while (C) HspB1 is predicted to be much less disordered. The αCD of HspB8 was predicted by sequence similarity to the crystallized αCD of HspB1. (B) Circular dichroism analysis shows the typical spectrum of a disordered protein for HspB8, while the analysis of HspB1 (D) reveals mainly beta-sheet content. (E) Quantification of the partitioning of HspB8 truncation variants into condensates formed by full-length FUSm as shown in (Figure 4B). (F) The onset of 5 µM FUSm fiber formation as a function of HspB8 truncation variant concentration. (G) Kinetics of the FUSm aging process. Plotted are the initial slopes of the FRAP recovery curves for FUSm condensates in the absence and presence of 5 µM HspB8 truncation variants. (H) Quantification of the partitioning of HspB8 truncation variants into condensates formed by the FUS-LCD in the presence of 10% Dextran. (I) Overview of HspB8-HspB1 swap variants used in this study. IDR8αCD1 carries an IDR from HspB8 and an αCD from HspB1. IDR1αCD8 carries an IDR from HspB1 and an αCD from HspB8. (J) Partitioning of 5 µM HspB8-HspB1 swap variants (1:20 mix of labeled:unlabeled) into 5 µM FUSm condensates. Scale bar is 10 µm. (K) Quantification of the partitioning experiment described in (G). (L) Aging assay of 5 µM FUSm condensates in the absence (ctrl) and presence of 5 µM HspB8 truncation variants. Scale bar is 10 µm. (M) The onset of 5 µM FUSm fiber formation as a function of HspB8-HspB1 swap variant concentration. (N) Kinetics of the FUSm aging process. Plotted are the initial slopes of the FRAP recovery curves for FUSm condensates in the absence and presence of 5 µM HspB8-HspB1 swap variants. αCD, α-crystallin domain; FRAP, fluorescence recovery after photobleaching; IDR, intrinsically disordered region; LCD, low complexity domain.