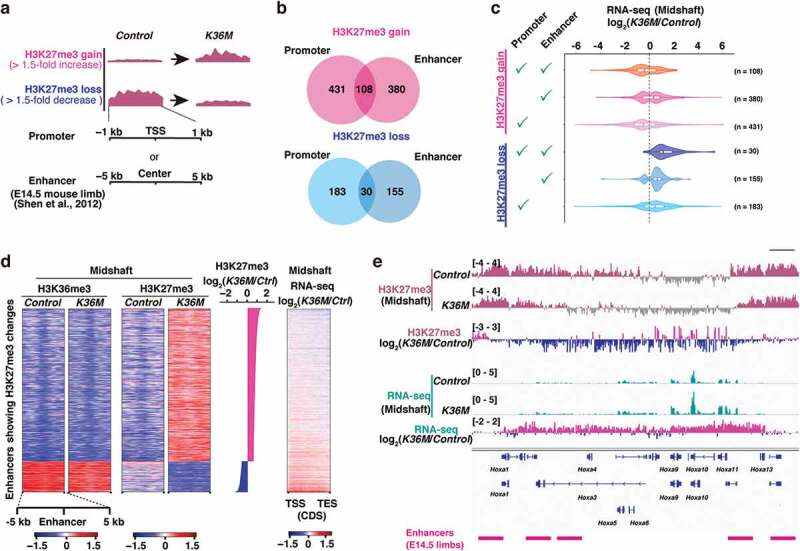
Figure 4.

Altered H3K27me3 at the regulatory elements is associated with impaired transcriptional control
(a) Analysis of changes in H3K27me3 enrichment at promoters and enhancers. Regions showing more than 1.5-fold gain or loss in K36M were adopted for subsequent analyses.
(b) Venn diagrams showing the number of differentially expressed genes coupled with the loss or gain of H3K27me3 at promoters and/or enhancers.
(c) Violin plots showing the relationship between changes in H3K27me3 enrichment and transcriptional alterations for corresponding genes.
(d) Heatmaps showing enrichment of H3K36me3 at enhances. Only enhancers whose H3K27me3 enrichment was affected by H3.3K36M were used for the analysis. Normalized enrichment (log2 ratio between H3K36me3 or H3K27me3 and input) for autosomes is displayed in a heatmap. The heatmap in the right-most column shows the change in expression of the corresponding genes. Ctrl, Control.
(e) Browser snapshots showing loss of H3K27me3 and transcriptional upregulation of HoxA cluster genes.
