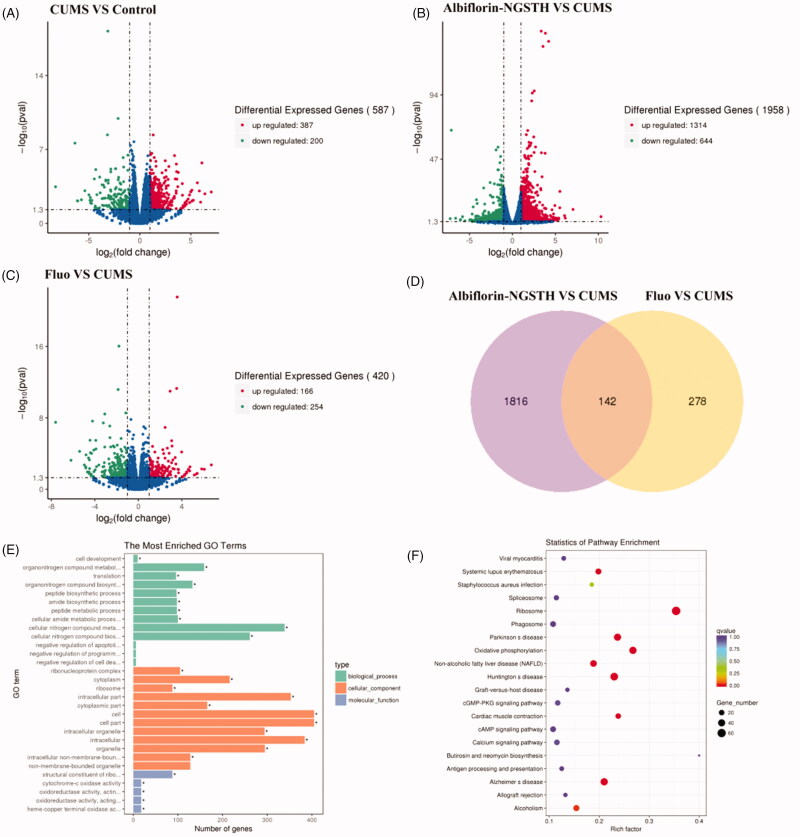
Figure 8.
Transcriptome analysis in the hippocampus of rats. Volcano map: (A) CUMS model compared with control group, (B) albiflorin-NGSTH compared with CUMS model, and (C) fluoxetine group compared with CUMS model. (D) Venn diagram of comparison of albiflorin-NGSTH and fluoxetine. (E) GO enrichment analysis of antidepressant effects of albiflorin-NGSTH. (F) KEGG pathway enrichment analysis of antidepressant effects of albiflorin-NGSTH.

