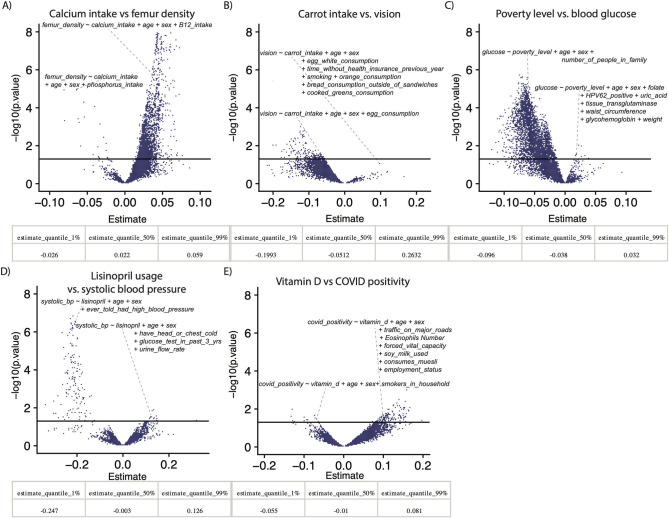
Fig 2. Examples of VoE for prominent associations.
Each point in the density plots represent at least one model. x-Axes are estimate size for beta-coefficients of interest (e.g., for panel A, the coefficient on the calcium intake variable). Quantiles show the range of estimate sizes for each above relationship. The y-axis is the −log10(p.value) of that association. The solid line is nominal (p < 0.05) significance. Data underlying these plots are available at https://figshare.com/account/home#/projects/120969 and S2 Table. VoE, vibration of effects.

