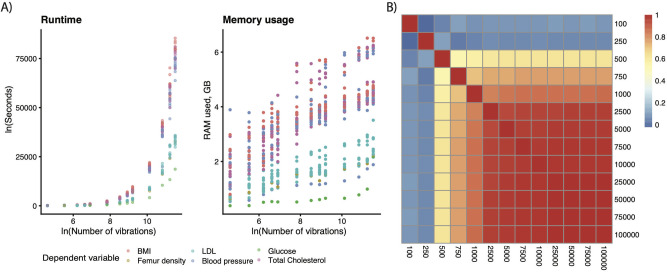
Fig 5. Software performance statistics.
(A) Runtime for different numbers of vibrations, (B) memory usage for different numbers of vibrations, and (C) consistency of results across the number of vibration associations (n). Heatmap color depicts the correlations between the coefficients in the nonmixed effects version of Eq (10). Data underlying these plots are available at https://figshare.com/account/home#/projects/120969. BMI, body mass index; LDL, low-density lipoprotein.

