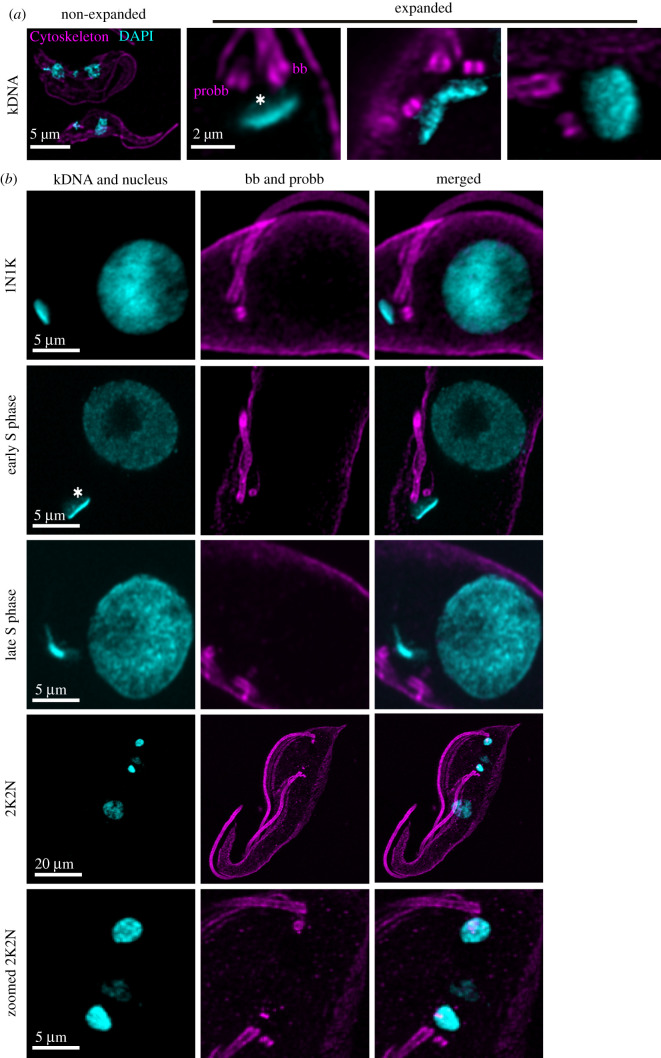
Figure 3.
Representative confocal images of kDNA during different stages of the cell cycle. (a) Comparative confocal images of expanded and non-expanded T. brucei kDNA (DAPI, cyan). (b) Representative images of the kDNA and basal bodies during different kDNA replication steps. DNA stained with DAPI (cyan); cytoskeleton stained with a monoclonal alpha-tubulin antibody (magenta; Alexa Fluor 647). Asterisk marks the ‘cloudy’ part of the kDNA. Imagery was deconvolved using Huygens Professional and visualized using Imaris.

