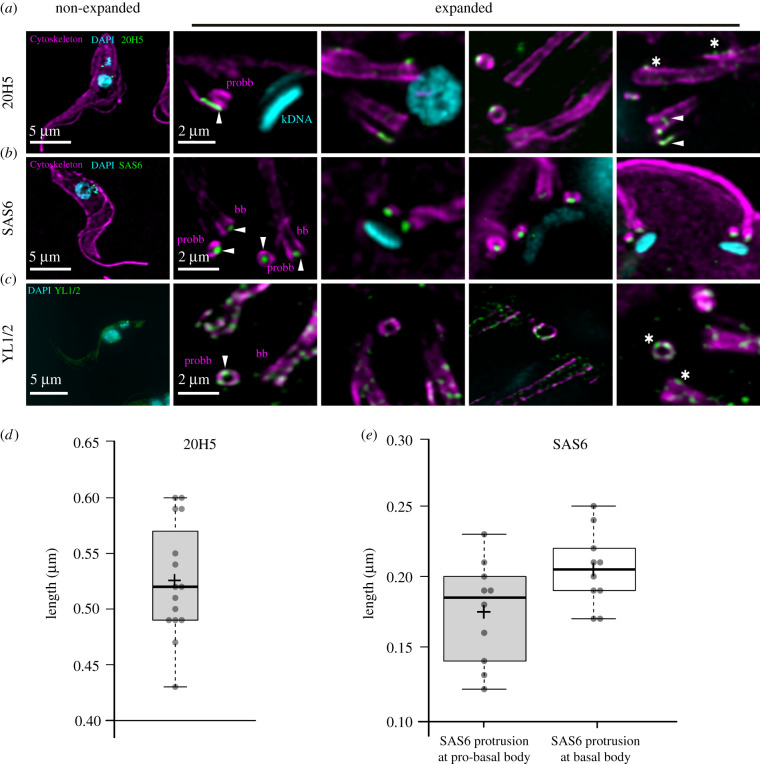
Figure 4.
Representative confocal images of basal body associated structures in U-ExM. (a) Centrin stained with anti-centrin antibody 20H5 (green), anti-α-tubulin antibody (magenta), kDNA and nucleus with DAPI (cyan). Arrowheads mark the centrin signal at the maturing basal body and microtubule quartet. Asterisk represents centrin signal at the old basal body and bilobe structure. (b) Anti-SAS6 antibody (green) localization at the basal body and pro-basal body (magenta). (c) Tyrosinated tubulin distribution (YL1/2, green) at the bb and probb (magenta). (d) Boxplot quantification of the length of 20H5 signal at the pro-basal body. (e) Quantification of SAS6 protrusion at the pro-basal body (the left graph) and basal body (the right graph). Imagery was deconvolved using Huygens Professional and visualized using Imaris.

