Figure 4.

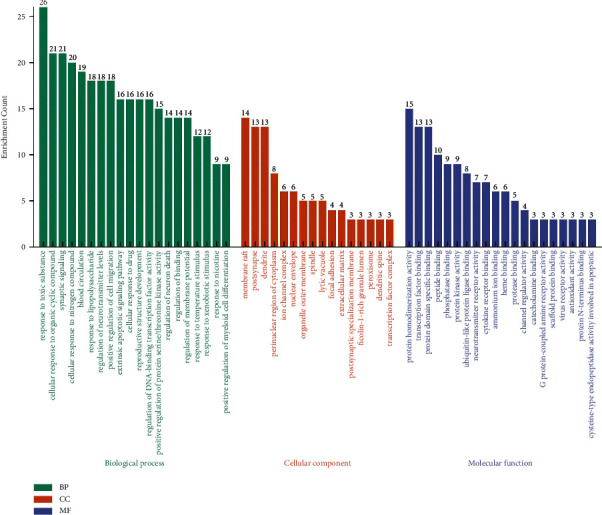
GO enrichment analysis of the 60 targets of HQSJZD. The chart is arranged in order from high to low according to the number of target distributions.

GO enrichment analysis of the 60 targets of HQSJZD. The chart is arranged in order from high to low according to the number of target distributions.