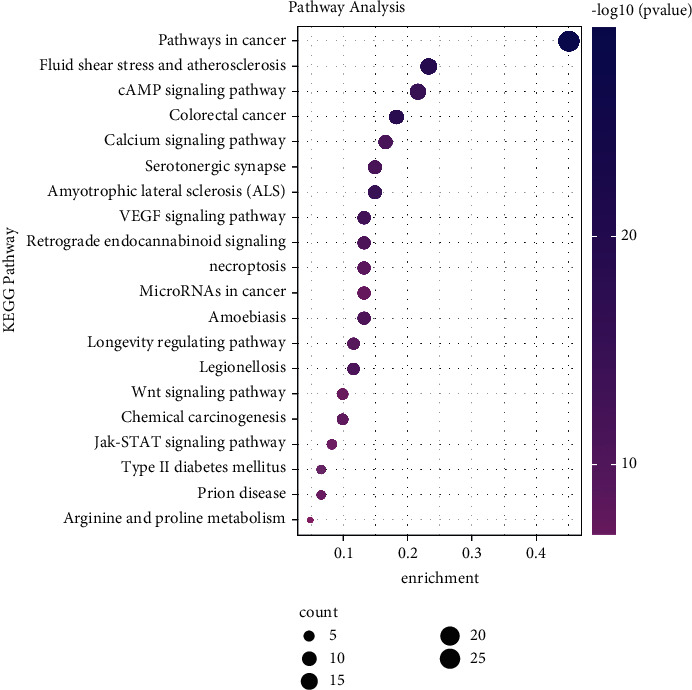
Figure 5.

KEGG enrichment analysis of the potential targets of HQSJZD. The larger rich factor stands for the higher level of enrichment. The size of the dot denotes the number of target genes in the pathway, and the color shade of the dot indicates the different P value range.
