Figure 1:

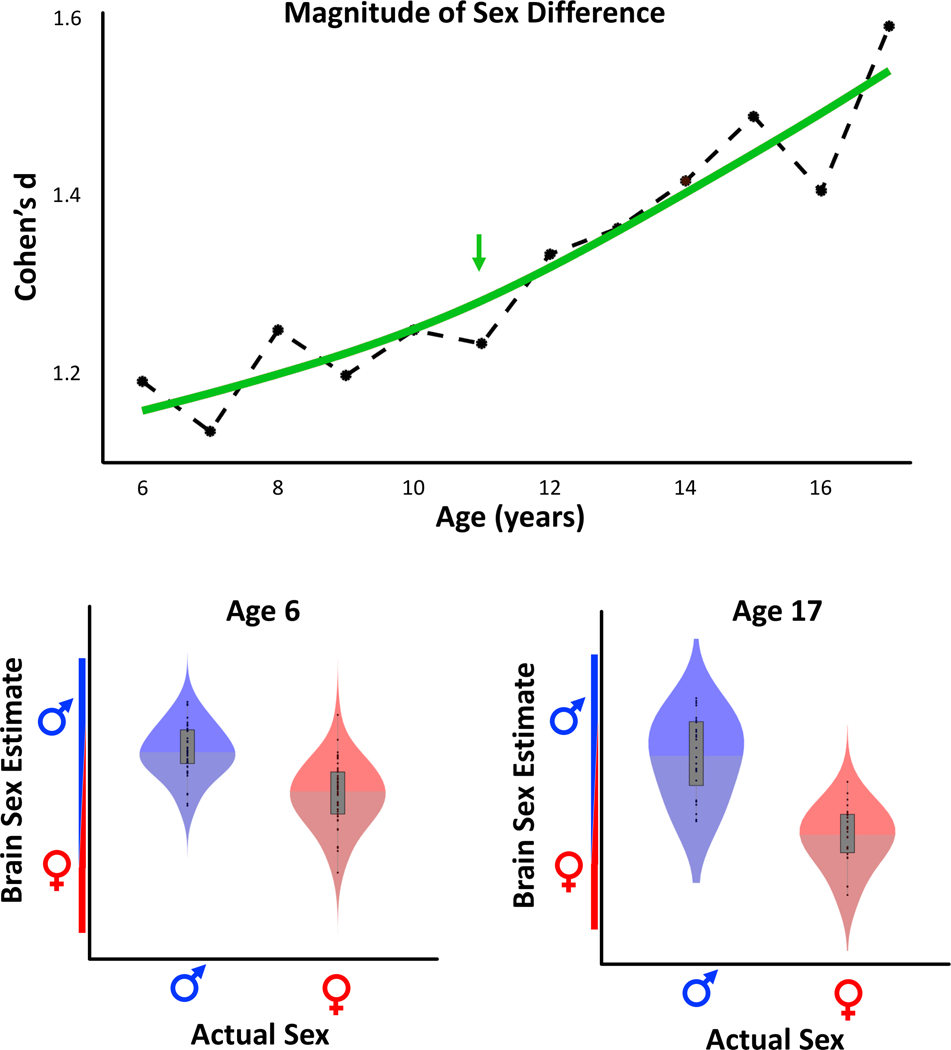
Age-specific sex differences. The top graph shows the magnitude of the difference between the ‘Brain Sex’ estimates in boys and girls (calculated as Cohen’s d) between age 6 and age 17 as markers connected by a dashed line. The fitted trajectory as determined by cubic smoothing splines is depicted in green, and the point of maximal acceleration is marked with a green arrow. The bottom graphs show the ‘Brain Sex’ estimates in relation to the actual sex for males (blue) and females (red) at age 6 and age 17. Note that the increased sex difference at age 17 corresponds to more homogeneous ‘Brain Sex’ estimates within each sex (particularly in girls) at age 17, which result in a reduced overlap between the predicted maleness / femaleness.
