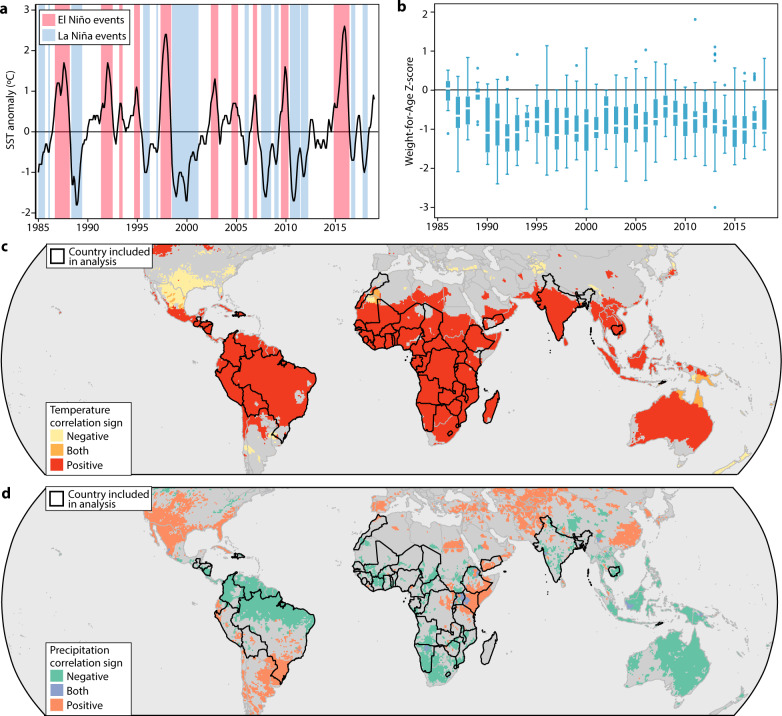
Fig. 1. Defining the sample of teleconnected children.
a ENSO time series. El Niño or La Niña highlighted in red or blue, respectively. El Niño and La Niña states are defined as follows: when the maximum of a 3-month rolling mean of monthly Oceanic Niño Index (ONI) values is >0.5 °C (Niño-like) or <−0.5 °C (Niña-like) compared to a moving reference climatology following NOAA CPC guidelines38. b Weight-for-age z-score distribution over time in teleconnected countries (n = 1,253,176 children from 51 surveys). Box plots indicate median (middle white line), 25th, 75th percentile (box), and 5th and 95th percentile (whiskers) as well as outliers (single points). Country composition within each year is different, as a rotating sample of countries is surveyed in each year under the DHS program. c Pixel-level monthly correlation of surface temperature (1980–2010) from the UDEL climate dataset and 2-month lag of NINO3.4 Sea Surface Temperature (SST) in teleconnected locations. Teleconnections are defined as pixels where the local temperature shows ≥3 statistically significant months of correlation with the second month lag of NINO3.4 SSTs. Country boundaries indicate sample countries (those having at least 50% of the population living in locations where local temperature is significantly correlated with the second month lag (t – 2) of the NINO3.4 SST index for at least 3 months of the year and with at least two Demographic and Health Surveys measuring anthropometrics). d Pixel-level monthly correlation of precipitation (1980–2010) and 2-month lag NINO3.4 SST. There is substantial heterogeneity in how precipitation is affected by ENSO, with areas of both positive and negative correlation. Country boundaries again show sample countries.

