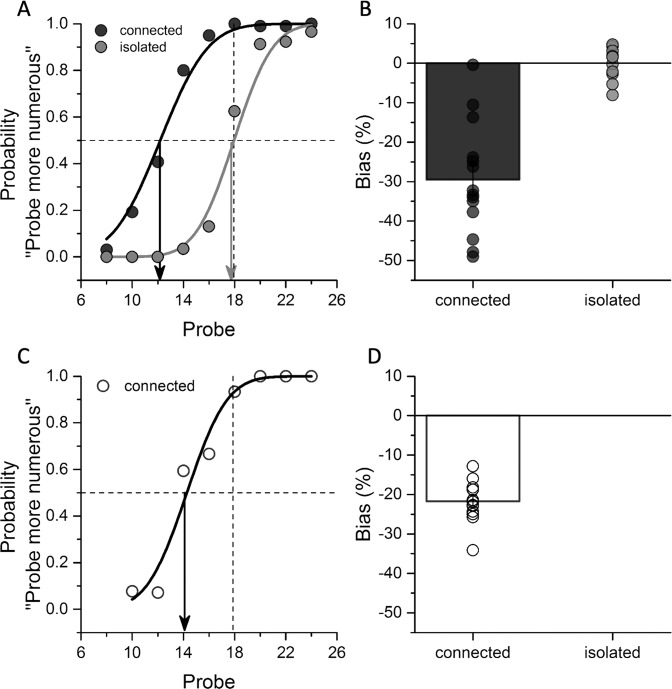
Fig. 2. Psychophysics results.
A Typical psychometric curves for one participant, measuring the connectedness effect on perceived numerosity for experiment 1. The proportion of trials in which the probe pattern was reported to be more numerous than the standard (which comprised 18 isolated dots) is plotted as a function of the number of dots in the probe pattern. Black and gray lines refer to the connected and isolated conditions, respectively. Arrows indicate the PSE measured in the two conditions. Leftward shifts of the psychometric curve imply underestimation of the test arrays. B Perceptual bias expressed as percentage of PSE difference from the reference numerosity for the two connectedness conditions. Bars represent average across participants (N = 14 participants, individual data reported as black and gray circles for the connected and isolated conditions, respectively), error bars show 1 SEM. C, D Example psychometric curve and average perceptual bias measuring the connectedness effect on perceived numerosity for experiment 2 (N = 13 participants, open circles). Bars represent average across participants and error bars show 1 SEM. The results from the first experiment (A, B) were replicated in the second one (C, D). Source data are provided as a Source Data file.

