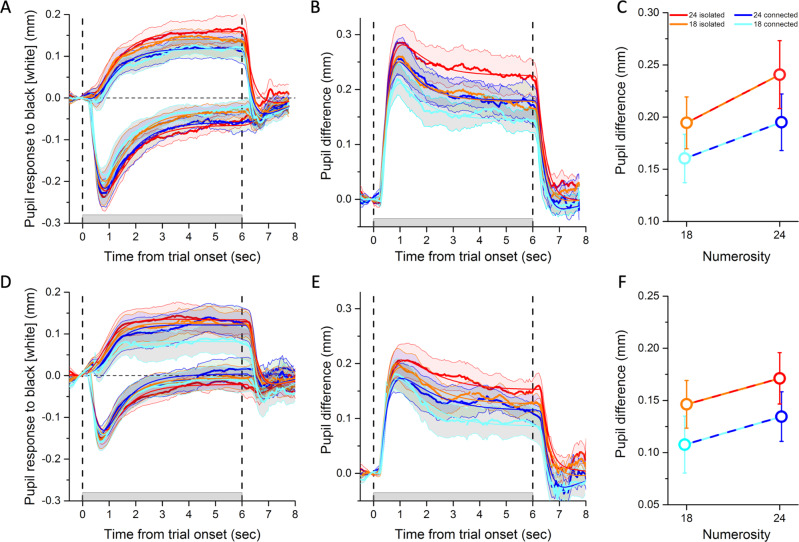
Fig. 3. Pupil responses to different numerosities and connectedness levels.
A Pupil dilation or constriction in response to black or white stimuli for the displaced-lines condition (experiment 1). Color-coded lines refer to the different numerosity and connectedness levels defined in the legend to C. The gray shaded area on the abscissa between the two vertical dashed lines show time of stimulus presentation. Thick lines plot the time courses of the pupil size averaged across participants (N = 16 participants) and the shaded area around them the SEM. Thin color-matched lines show the average fit obtained by convolving stimulus predictors with the pupil response function (defined by parameters listed in Supplementary Table 1). B Time course of the pupil difference (dark minus light responses) estimating the net pupillary response to luminance. C Average pupil difference in the interval 1–6 s after stimulus onset (the stimulus duration minus the first second, which we excluded to discard the fast and transient pupillary onset response). Dots represent averages across participants (N = 16 participants) and error bars are SEM. D–F Same as A–C, for the removed-lines condition (experiment 2). Open circles represent averages across participants (N = 13 participants) and error bars are SEM. Repeated-measures ANOVAs tested for pupil differences between numerosity and connectedness levels. Significance of main effects and interactions are reported in text. The results from the first experiment (A–C) were replicated in the second one (D–F). Source data are provided as a Source Data file.

