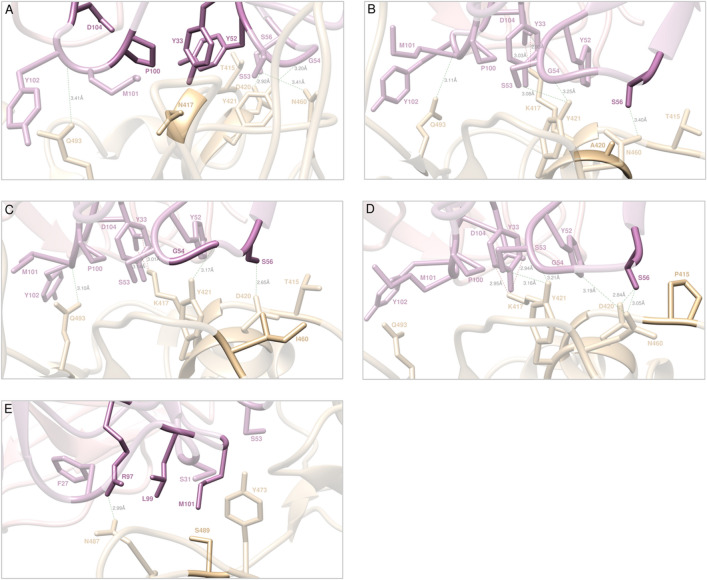
Figure 7.
Main interactions involving the S-RBDCoV‑2 K417N (A), D420A (B), N460I (C), T415P (D), and Y489S (E) mutants at the interface with the LY-CoV016 (etesevimab) mAb as obtained from the relevant equilibrated MD simulations. Images for all other circulating mutants (K417E/R/T, D420G/, N460K/S/T, T415A/I/N/S and Y489C/F/H) are shown in Figures S11–S14 and S18 (see also Tables S19–S22 and S26 for details). Colors and other explanations as in Fig. 5.

