
Fig. 7. Non-Hermitian band topology via odd micropolar elasticity.
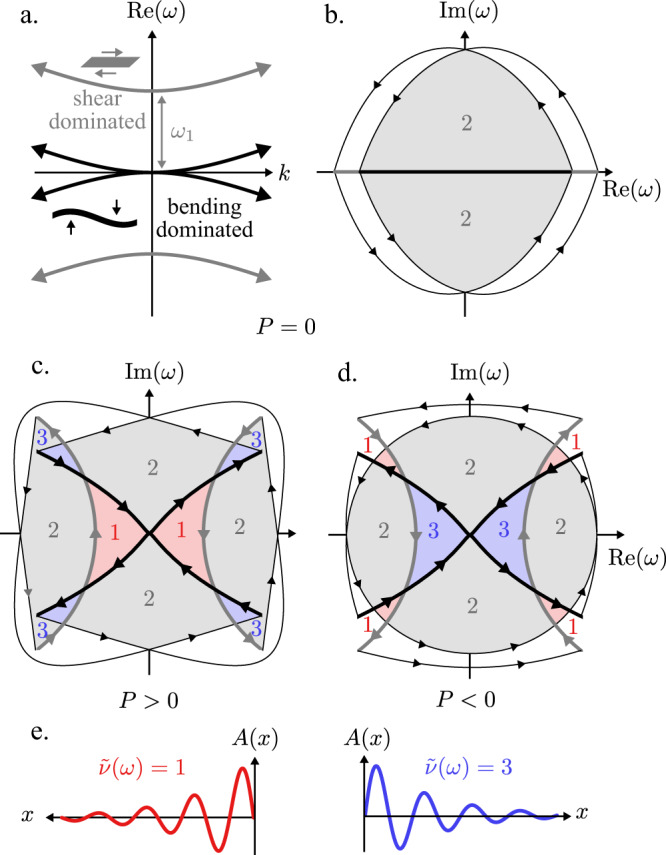
a The spectrum for P = 0 features a pair of bending dominated bands (black) and shear dominated bands (gray) separated by a band gap ω1. (b-d) The spectrum is shown in the complex ω plane for P = 0, P > 0, and P < 0. The thick black lines represent the bending dominated band, while the thick gray lines represent the shear dominated bands, both with k ∈ [−R, R] for a finite R. The thin black lines represent the analytical continuation of the spectrum for k = Reiφ for φ ∈ [0, π]. The arrows indicate the direction of increasing k. The numbers indicate the value of ν(ω) for ω in the corresponding colored regions of the complex plane. This number corresponds to the number of times that the spectrum winds around a given region. e For a semi-infinite system with a free boundary, the winding number of = 1 ( = 3) for our continuum theory indicates a mode localized to the right (left) boundary. The wave forms schematically depict the localization with A(x) representing amplitude. For a calculation of the precise eigenvectors, see Supplementary Note 1.