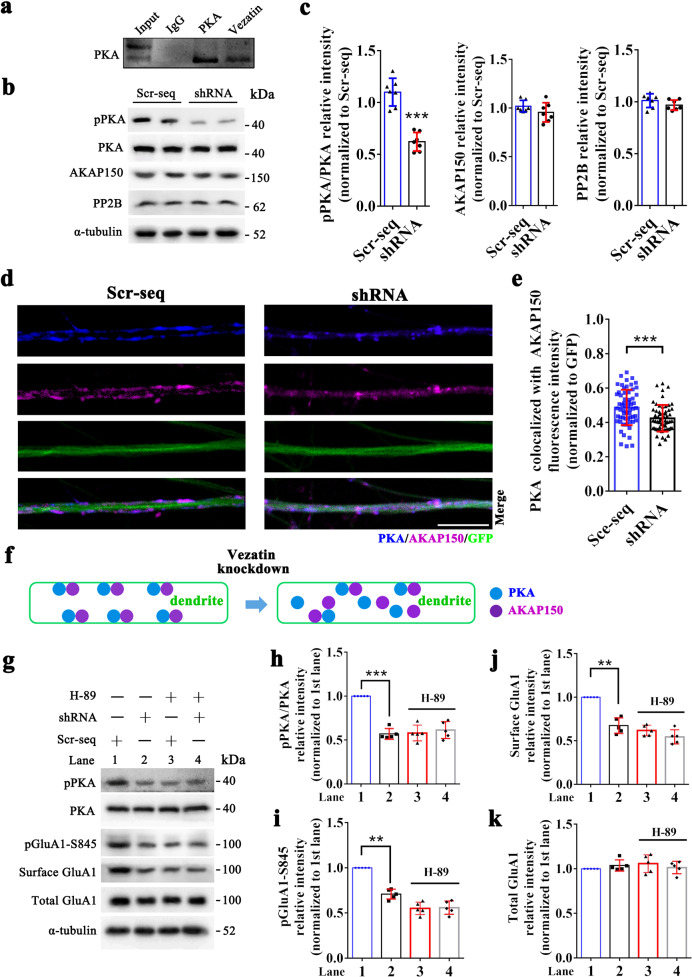
Fig. 6. PKA signaling mediates the regulatory effect of vezatin on the phosphorylation of GluA1 at serine 845.
a Representative coimmunoprecipitation image showing the interaction between vezatin and PKA in the hippocampi of mice. In the PILO-induced epilepsy model, b representative images of western blots showing pPKA levels, which was calculated as the pPKA to total PKA ratio, and the expression of AKAP150 and PP2B in the hippocampus of the Scr-seq group and shRNA group and c the corresponding statistical analyses (n = 7 per group; pPKA/PKA, P < 0.001; Student’s t test; ***P < 0.001). In the Mg2+-free medium-induced in vitro seizure-like model, d representative images of immunofluorescence staining comparing the distribution and colocalization (blue–purple) of PKA (blue) and AKAP150 (purple) in LV-infected neuronal dendrites (green) between the Scr-seq group and shRNA group and (e) the corresponding statistical analysis of the fluorescence intensity of the colocalization of PKA and AKAP150 between the Scr-seq group and shRNA group (P < 0.001; Student’s t test; ***P < 0.001) (n = 5 independent hippocampal neuron cultures from ten mice per group). f The corresponding schematic of the effect of vezatin knockdown on the distribution and colocalization of PKA and AKAP150 is also shown. In the Mg2+-free medium-induced in vitro seizure-like model, g representative images of western blots show that H-89 blocks the effect of vezatin knockdown on the level of pGluA1-S845 and the surface expression of GluA1, along with the corresponding statistical analyses of pPKA/PKA (P < 0.001) (h), pGluA1-S845 (P = 0.001) (i), surface GluA1 (P = 0.003) (j), and total GluA1 expression (k) (n = 5 independent hippocampal neuron cultures from ten mice per group). Two-way ANOVA followed by the Bonferroni post hoc test; *P < 0.05, **P < 0.01, and ***P < 0.001.

