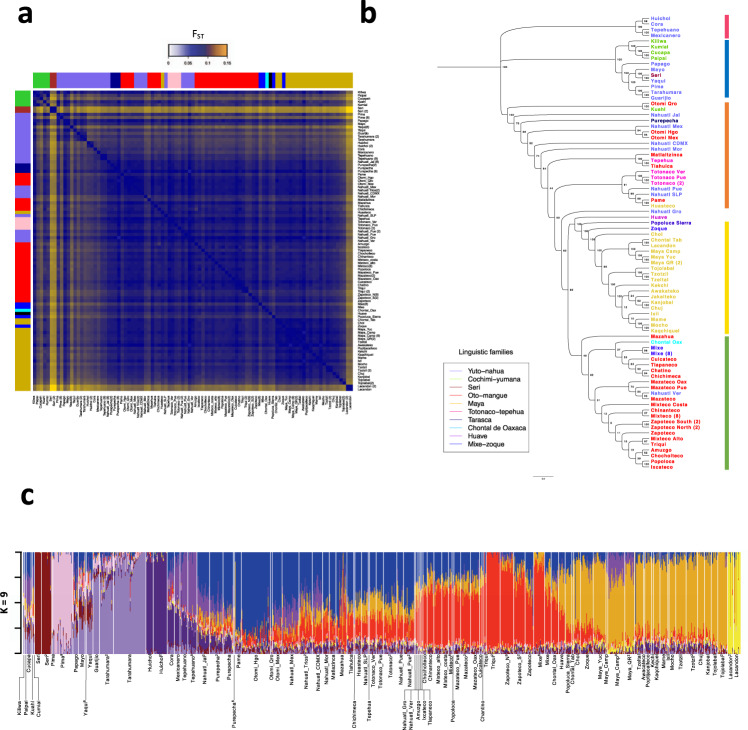
Fig. 2. The genetic diversity of Indigenous groups correlates with their geographic distribution.
a Pairwise-FST matrix for all tested populations. Colored bars represent the linguistic family. b FST-based neighbor-joining tree showing the correlation with geographic location independent of linguistic classification (colored names), the numbers above the branches indicate the bootstrap values. Colored vertical lines represent the identified geographic regions: North (blue), Northwest (red), Central-east (orange), South (green), and Southeast (yellow). c Admixture analysis assuming K = 9 clusters in Mexican Indigenous populations. Superscript numbers are the corresponding references.

