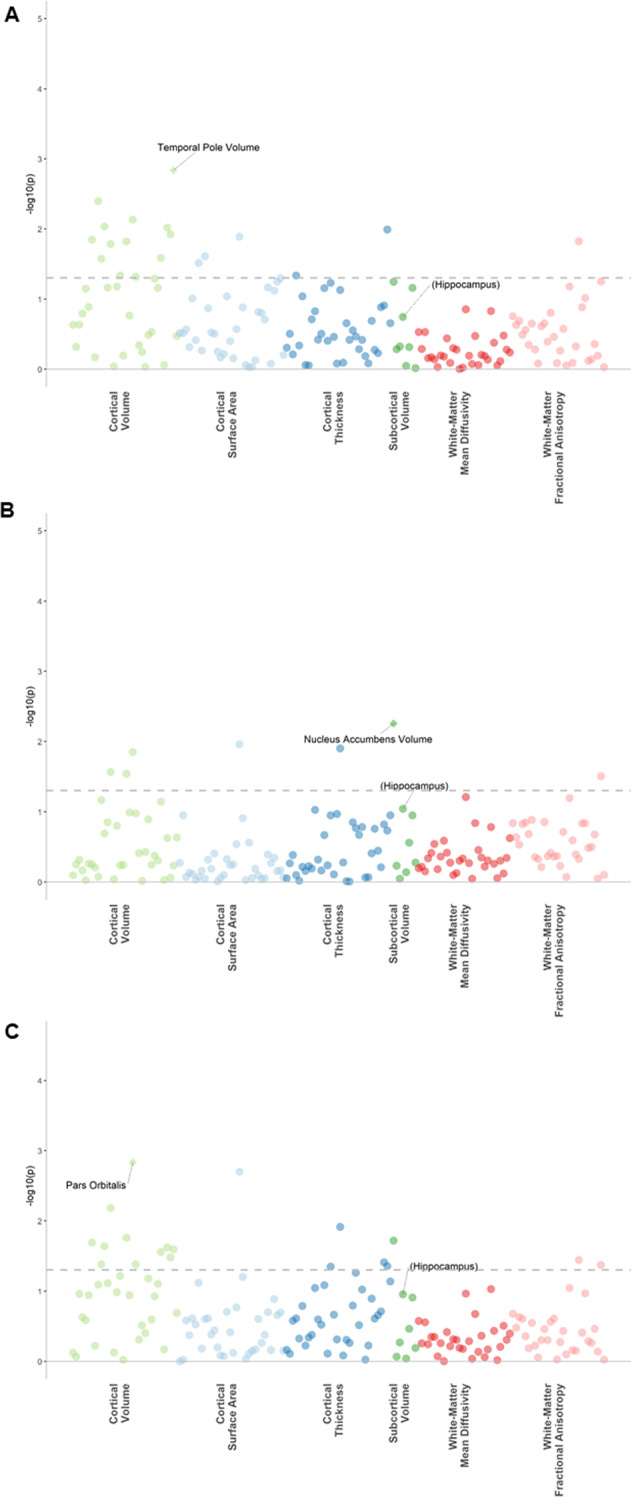
Fig. 4. Significance plot for cortisol, cortisone and total glucocorticoid associations with regional structural imaging phenotypes.

A Cortisol, B cortisone, and C total glucocorticoid. The x-axes represent structural imaging phenotypes, and the y-axes represent the −log10 of uncorrected p-values between the measure and the imaging phenotype corrected for covariates. Each dot represents one imaging phenotype, and the colours indicate their categories. The dashed lines indicate the p-value threshold of 0.05 and the diamonds represent phenotypes that survive FDR correction. The hippocampus (not significant) is marked in brackets for reference to previous studies.
