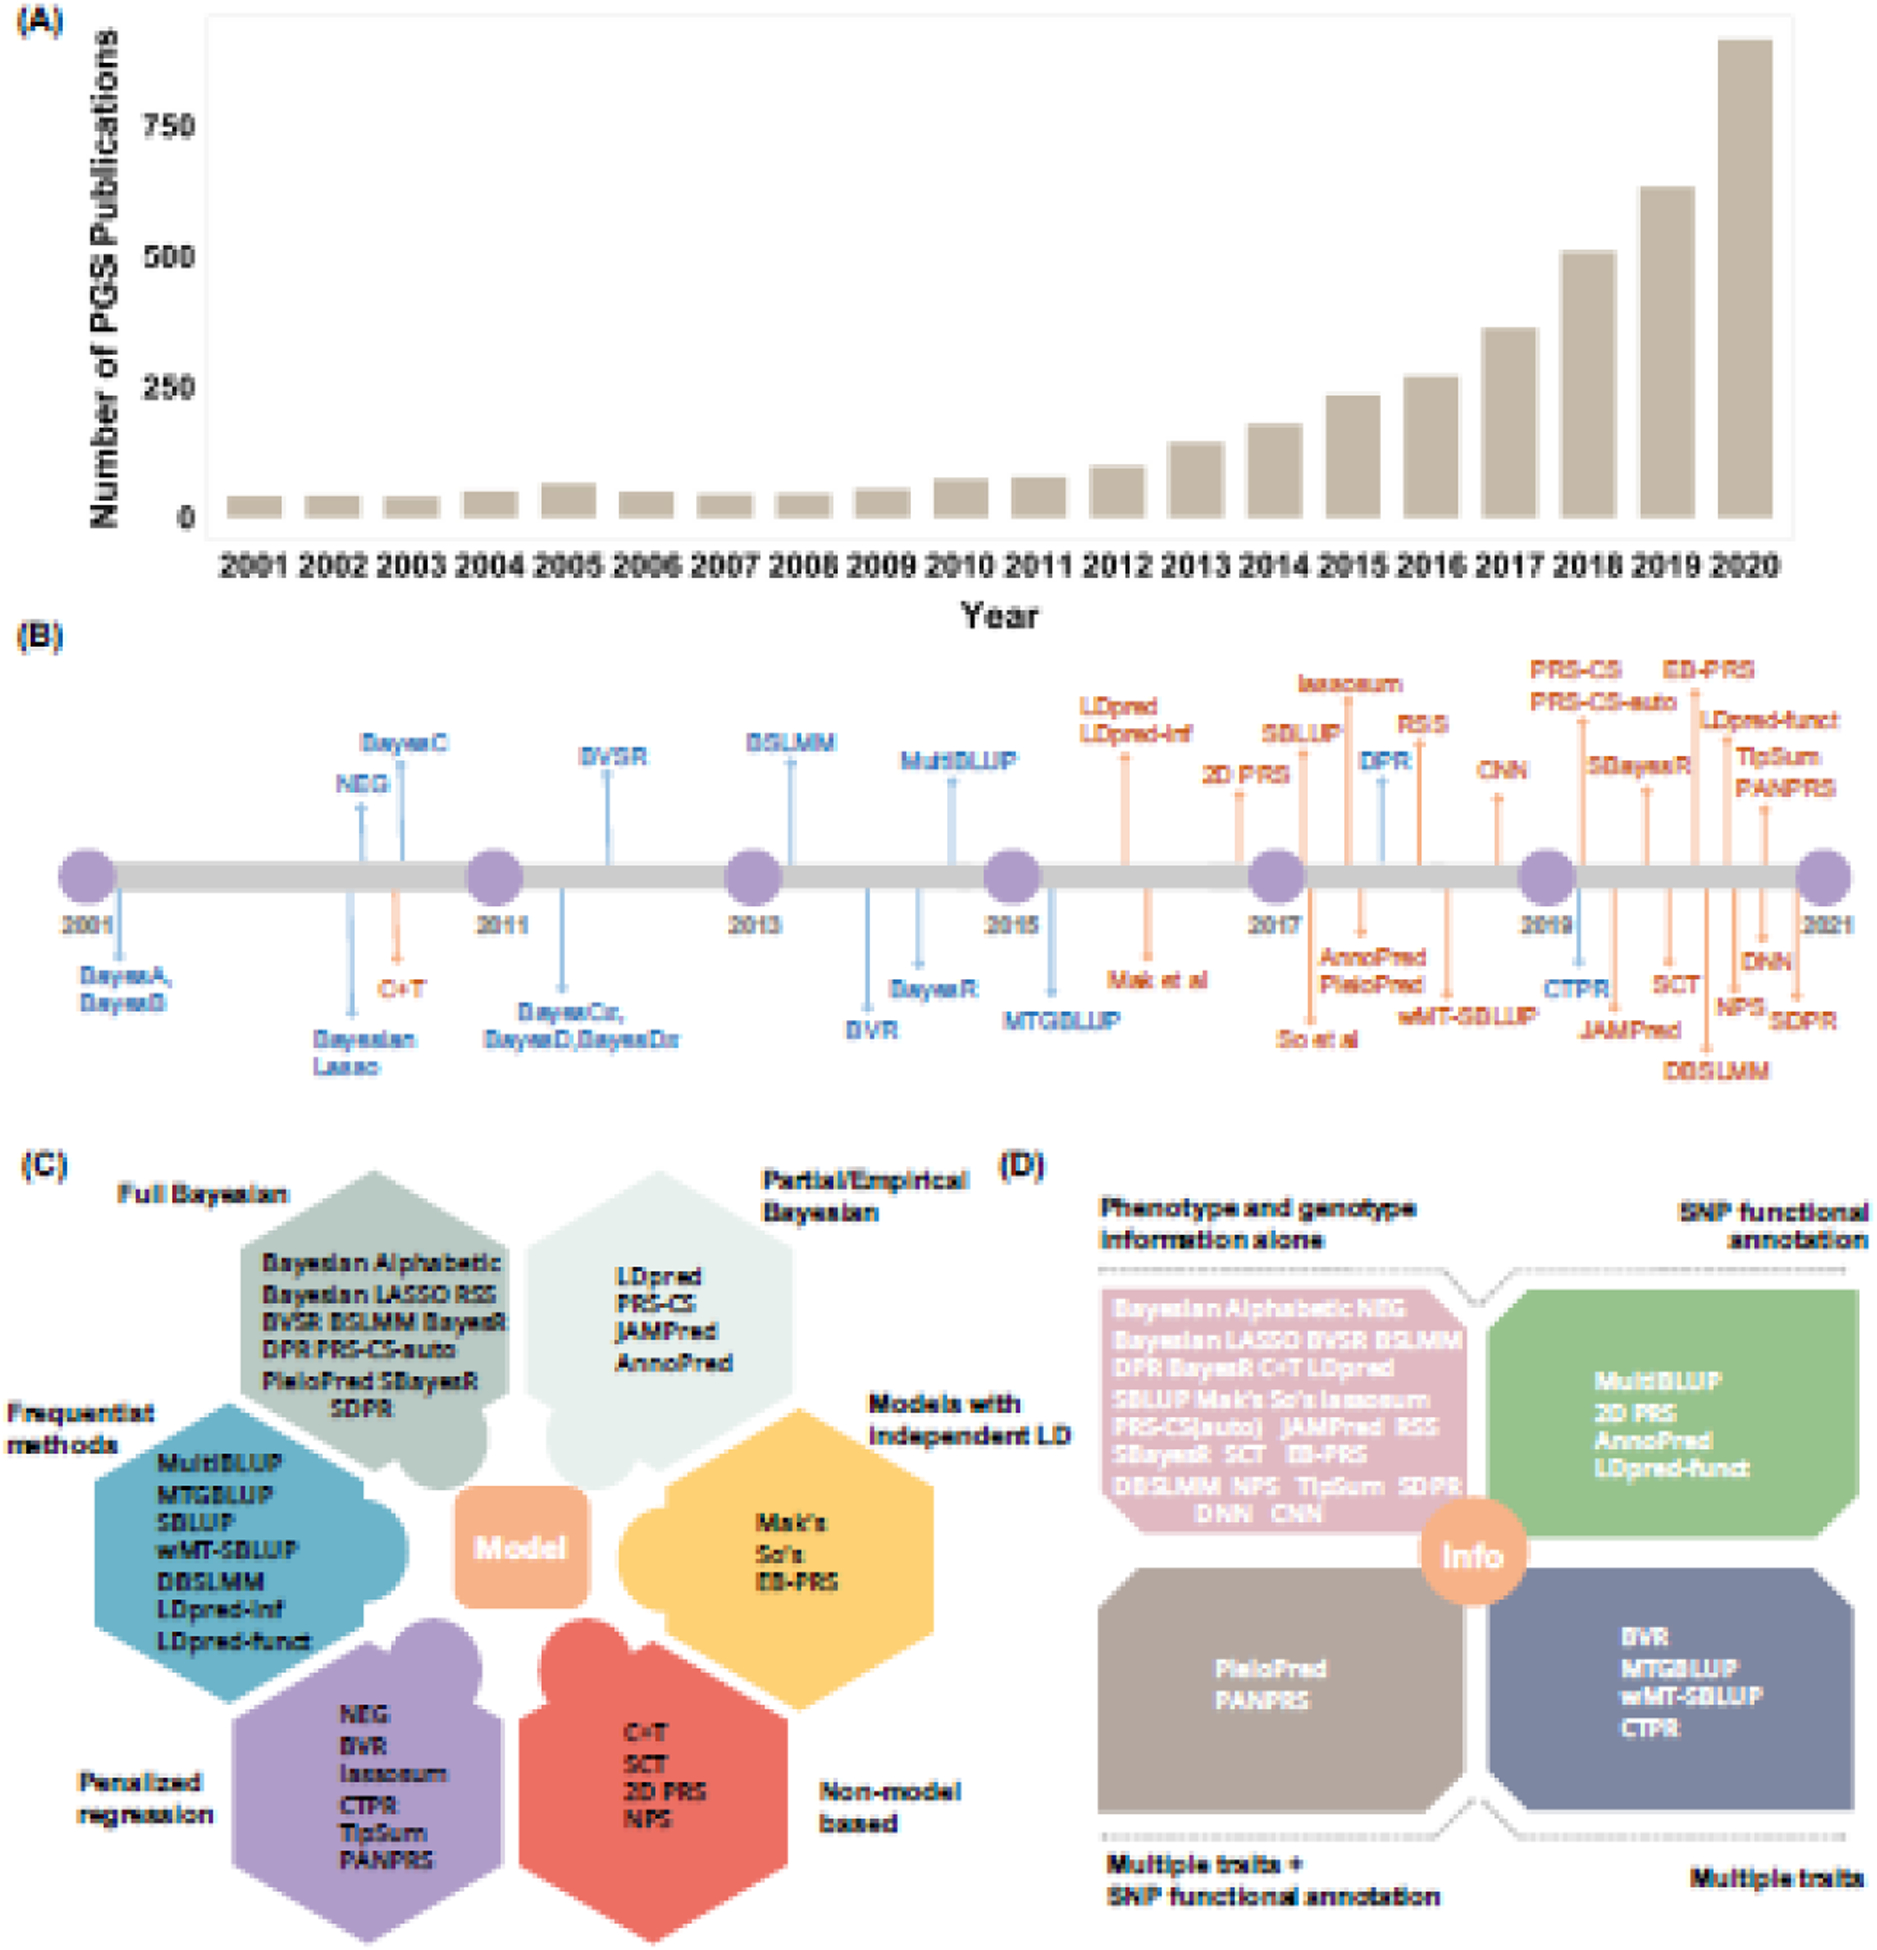
Figure 1. An overview of PGS methods.

(A) The number of publications on polygenic scores increased substantially from 2001 to 2020, highlighting the popularity of PGS analysis. The number of publications is obtained by searching the key terms of “polygenic + score + or + polygenic + risk + score” on PubMed. (B) Timeline of the commonly used PGS methods that were developed in the past two decades. These PGS methods either use individual-level genotype and phenotype data as input (blue) or use summary statistics as input (orange). (C) PGS methods can be categorized into six categories based on their model and fitting strategy. Specifically, some PGS methods are model based and are described as a formal model with a corresponding fitting algorithm (colors other than red), while others are algorithm-based and are described as an algorithm or a fitting procedure without an explicit model (red). The model-based PGS methods can be further categorized based on the underlying inference algorithm: some are fully Bayesian and use Markov chain Monte Carlo (MCMC) for model fitting (grey); some are partial/empirical Bayesian, optimizing certain hyperparameters through grid search while obtaining other parameter estimates through MCMC (light grey); some are approximate approaches that assume independence across SNPs and use optimization for effect size estimation (yellow); some are frequentist in nature and can obtain an analytic solution without optimization (blue); and some are based on penalized regression and use iterative algorithms for parameter estimation (purple). (D) PGS methods can also be categorized in terms of the information used for PGS construction. Most PGS methods use only genotype and phenotype information from the GWAS on the trait of interest (pink). Some recent PGS methods can use additional SNP annotation information obtained from external data sources (green) and/or other phenotype information in addition to the phenotype of interest (taupe and navy blue).
