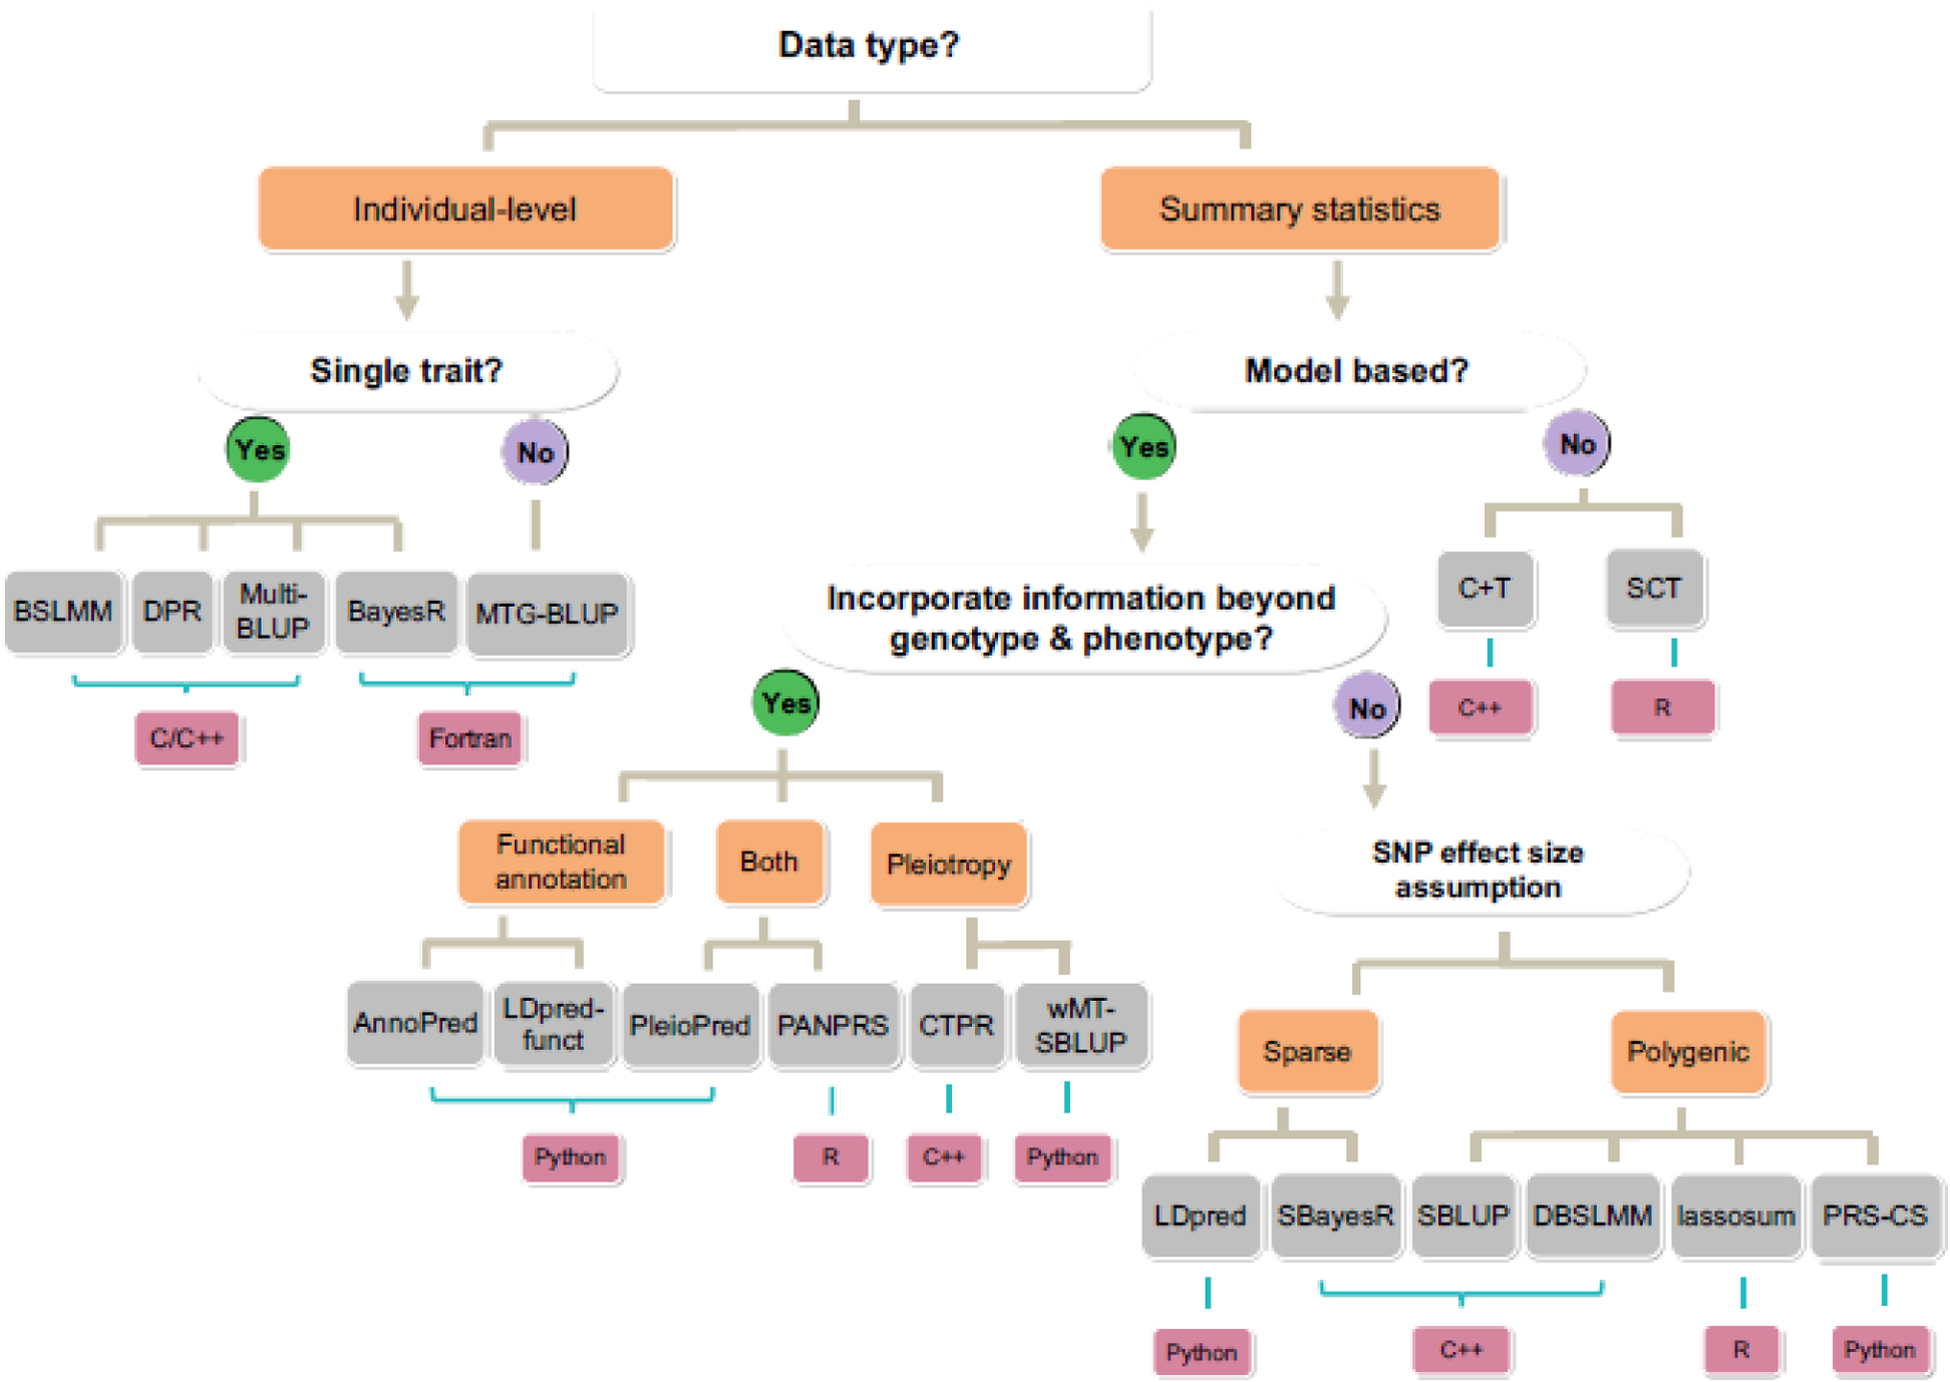
Figure 4. A decision tree on which methods to use for PGS analysis.

The decision tree begins with input data type, followed by the choices of analyzing single versus multiple traits, using model-based methods versus algorithm-based methods, whether to incorporate information beyond genotype and phenotype, as well as the detailed SNP effect size assumptions (blue brackets). The choices include Yes/No answers (Yes in green circles and No in purple circles) or other qualitative options (orange brackets). Different choices lead to different PGS methods (grey brackets), which are implemented with different computing language (pink brackets).
