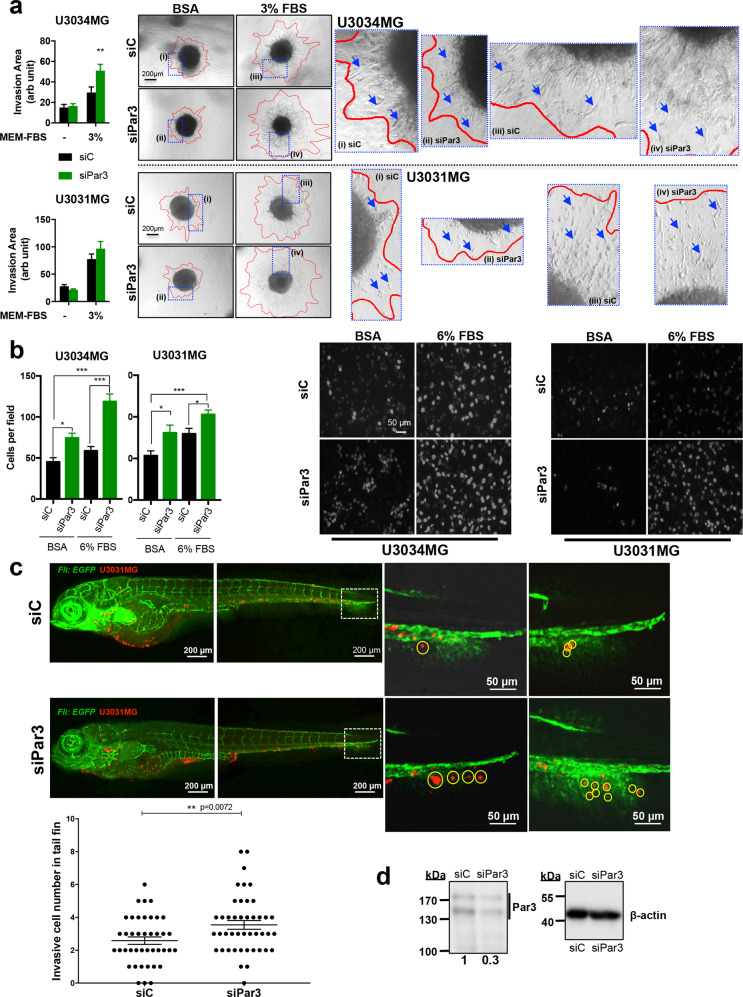
Fig. 3. Reduction in Par3 enhances cell migration and invasion.
a Spheroids of U3031MG and U3034MG transfected with control (siC, black bars) or Par3 (green bars) siRNA embedded in collagen, invaded the matrix in the presence of MEM containing BSA (-) or MEM containing 3% FBS, and assayed after 48 h. Quantification (left) expresses results as mean ± SEM out of multiple independent experiments (for U3031MG, n = 2 with five biological replicates; for U3034MG, n = 4 with 3 biological replicates), and statistical comparison (t-test) indicates significant differences, *p < 0.05, **p < 0.01. Representative photomicrographs with red lines demarcating the outer rim formed by invasive cells (right); blue rectangles indicate magnified areas of the invasive rim with arrows pointing to invading cells. b Transwell-based invasion assays of U3031MG and U3034MG cells transfected with control (siC, black bars) or Par3 (green bars) siRNA, migrating through laminin towards DMEM/BSA or DMEM/6% FBS. Left, quantification of the number of cells per field (for U3034MG, n = 2 and for U3031MG, n = 3, in duplicate each time; for each independent experiment 15 different fields were quantified). Right, representative photomicrographs of stained nuclei of invasive cells (magnification bar, 50 µm). Results are expressed as mean ± SEM and statistical comparison (t-test) indicates significant differences, *p < 0.05, ***p < 0.001. c Invasive capacity of CM-Dil-labeled U3031MG cells after silencing Par3 was assessed in vivo after injecting approximately 400 cells in the transgenic Fli:EGFP zebrafish embryos with endothelial-specific EGFP expression. Extravasation and collagenous tail fin invasion were observed. One representative image of the whole zebrafish from each group is shown in the left panel, with two zoom-in images of the invasive cells in the tail fins of two different zebrafish from each group shown on the right panel. Invasive cells are indicated with yellow circles in the zoom-in images. Quantification of invading U3031MG numbers per fish, n = 40, presented as MEM ± S.E.M (left). Statistical comparison (t-test); significant differences, **p < 0.01. d Immunoblot demonstrating Par3 silencing efficiency in U3031MG cells injected in the zebrafish embryos. β-Actin serves as loading control, densitometric values of Par3 expression relative to β-actin are listed and molecular size markers in kDa are shown.

