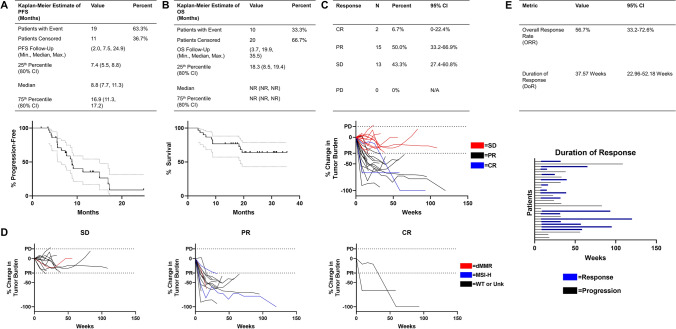
Fig. 1.
Progression-free survival, overall survival, and RECIST response. The Kaplan–Meier method was used to determine median progression-free survival (PFS) (a) and median overall survival (OS) (b) in patients on the trial. Patients without events were censored and are indicated by tick marks on the survival curves. RECIST v1.1 was utilized to determine disease response (c) which is displayed with Agresti-Coull 95% confidence intervals. Tumor growth curves are displayed and color coded by RECIST response (c) or molecular alterations (d). The cutoffs for progressive disease and partial response are indicated by dotted lines. Overall response rate (ORR) and duration of response (DoR) are displayed (e). Blue bars indicate recorded period of response (CR and PR) in patients who responded (e). CI confidence interval, PFS progression-free survival, OS overall survival, CR complete response, PR partial response, SD stable disease, PD progressive disease, ORR overall response rate, DoR duration of response

