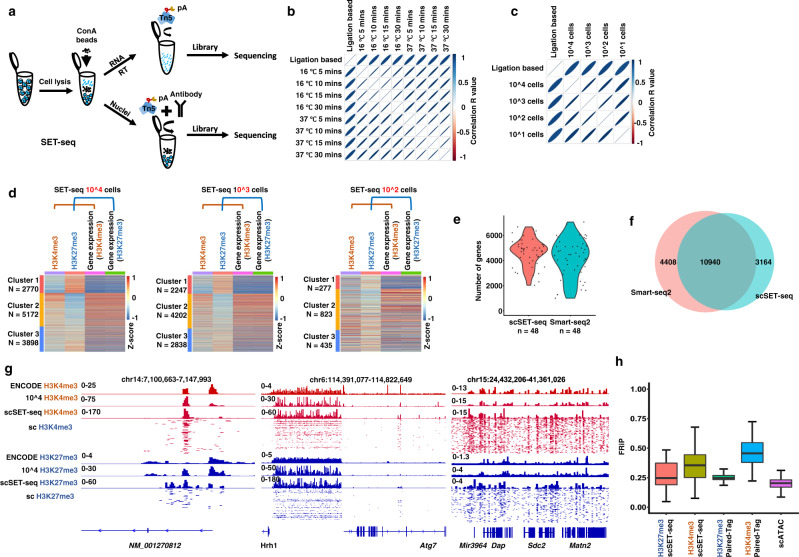
Fig. 1. SET-seq can be used to profile epigenome and transcriptome in the same sample.
a Schema showing the process of SET-seq. b The Pearson correlations among gene expression libraries constructed from different tagmentation time and temperatures. c The Pearson correlations among gene expression libraries constructed from different numbers of cells. d Heatmaps showing the clustering results of H3K27me3 and H3K4me3 SET-seq. Genes, at which the epigenomic and transcriptional signals were detected, were clustered by hierarchical clustering algorithms using row scaled signal scores. Heatmaps were plotted with column scaled signal scores. e Number of detected genes in scSET-seq and Smart-seq2 in 48 mESCs. Smart-seq2 data were downloaded from GSE151334 [https://www.encodeproject.org/experiments/ENCSR059MBO/] and 48 cells were randomly selected. f Venn diagram showing the overall detected genes between scSET-seq and Smart-seq2 in 48 mESCs. Smart-seq2 data were as in e. g Examples of IGV views of H3K27me3 and H3K4me3 scSET-seq. Signals of histone marks from 200 individual single cells were shown below the signals from aggregated 480 cells. H3K4me3 and H3K27me3 SET-seq results from 10,000 cells (10^4 H3K4me3 and 10^4 H3K27me3) were shown as controls. h The fraction of reads in peaks (FRiPs) of scATAC-seq and scSET-seq. scATAC-seq data were downloaded from GSE100033 [https://www.ncbi.nlm.nih.gov/geo/query/acc.cgi?acc=GSE151334]. scSET-seq cells were filtered with a mapping ratio >10%. Paired-Tag and 10x genomics data was same as previous reported43. The boxes were drawn from lower quartile (Q1) to upper quartile (Q3) with the middle line denoting the median, and whiskers with maximum 1.5 IQR (interquartile range). n = 45 (H3K27me3 scSET-seq), 200 (H3K4me3 scSET-seq), 447 (H3K27me3 Paired-Tag), 1,659 (H3K4me3 Paired-Tag), and 93 (scATAC-seq) cells. Source data are provided as a Source Data file.

