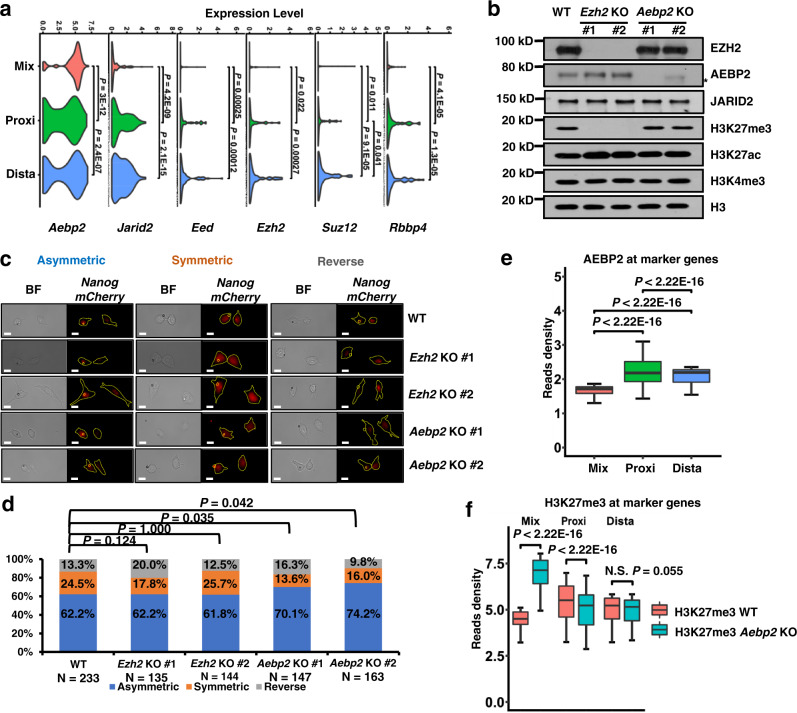
Fig. 6. Aebp2 knockout increases the cells asymmetrically expressing Nanog-mCherry.
a Violin plots showing the average expression levels of components of PRC2 in the Mix, Proxi, and Dista clusters. To increase the reproducibility, the gene expressions of H3K27me3 and H3K4me3 scSET-seq were merged for plotting. P values were calculated by Student’s t-test, two-sided. Rbbp7 was not detected in the scSET-seq. n = 291 (Mix), 133 (Proxi), and 121 (Dista) cells. b Western blot showing the indicated protein levels in parental and KO mESCs. Ezh2 KO decreased the total levels of H3K27me3 and increased the H3K27ac. Aebp2 KO didn’t exhibit obvious effects on the total levels of tested histone marks. Cell extracts were analyzed via Western blotting using the indicated antibodies, and two biological replicates were performed for each blot. Star indicated a nonspecific band. See Supplementary Fig. S14 for the Sanger sequencing results of KO clones. c Representative images of divided Nanog-mCherry mESCs cocultured with Wnt3a beads. Wnt3a beads and cells were marked in the immunofluorescence image. Asymmetric, higher mCherry amounts in the bead-proximal cell; Symmetric, similar amounts of mCherry in either cell; Reverse, higher amounts of mCherry in the bead-distal cell. BF, bright field. Scale bar, 15 µm. d The percentages of asymmetrically, symmetrically, and reversely divided cells, as defined by Nanog-mCherry signals, in parental, Ezh2 and Aebp2 KO cells. P values were calculated by chi-squared test. e The enrichments of AEBP2 at cluster marker genes that were identified by gene expression. AEBP2 peaks were first called and annotated to the closet transcription starting sites within 20 Kb. The reads density of Aebp2 was then calculated for peaks annotated to each gene. P values were calculated by Student’s t-test, two-sided. The boxes were drawn from lower quartile (Q1) to upper quartile (Q3) with the middle line denoting the median, and whiskers with maximum 1.5 IQR (interquartile range). n = 90, 108, and 200 Aebp2 peaks at Mix, Proxi and Dista markers, respectively. n = 1000 (Mix), 1000 (Proxi), and 1000 (Dista) bins of Aebp2 at cluster marker genes. f The enrichments of H3K27me3 at cluster marker genes that were identified by gene expression. H3K27me3 peaks were first called in WT and Aebp2 KO cells, merged, and annotated to the closet transcription starting sites within 20 Kb. The reads density of H3K27me3 was then calculated for peaks annotated to each gene. P values were calculated by Student’s t-test, two-sided. The boxes were drawn from lower quartile (Q1) to upper quartile (Q3) with the middle line denoting the median, and whiskers with maximum 1.5 IQR (interquartile range). n = 504, 243, and 371 H3K27me3 peaks at Mix, Proxi, and Dista markers, respectively. Source data are provided as a Source Data file.

