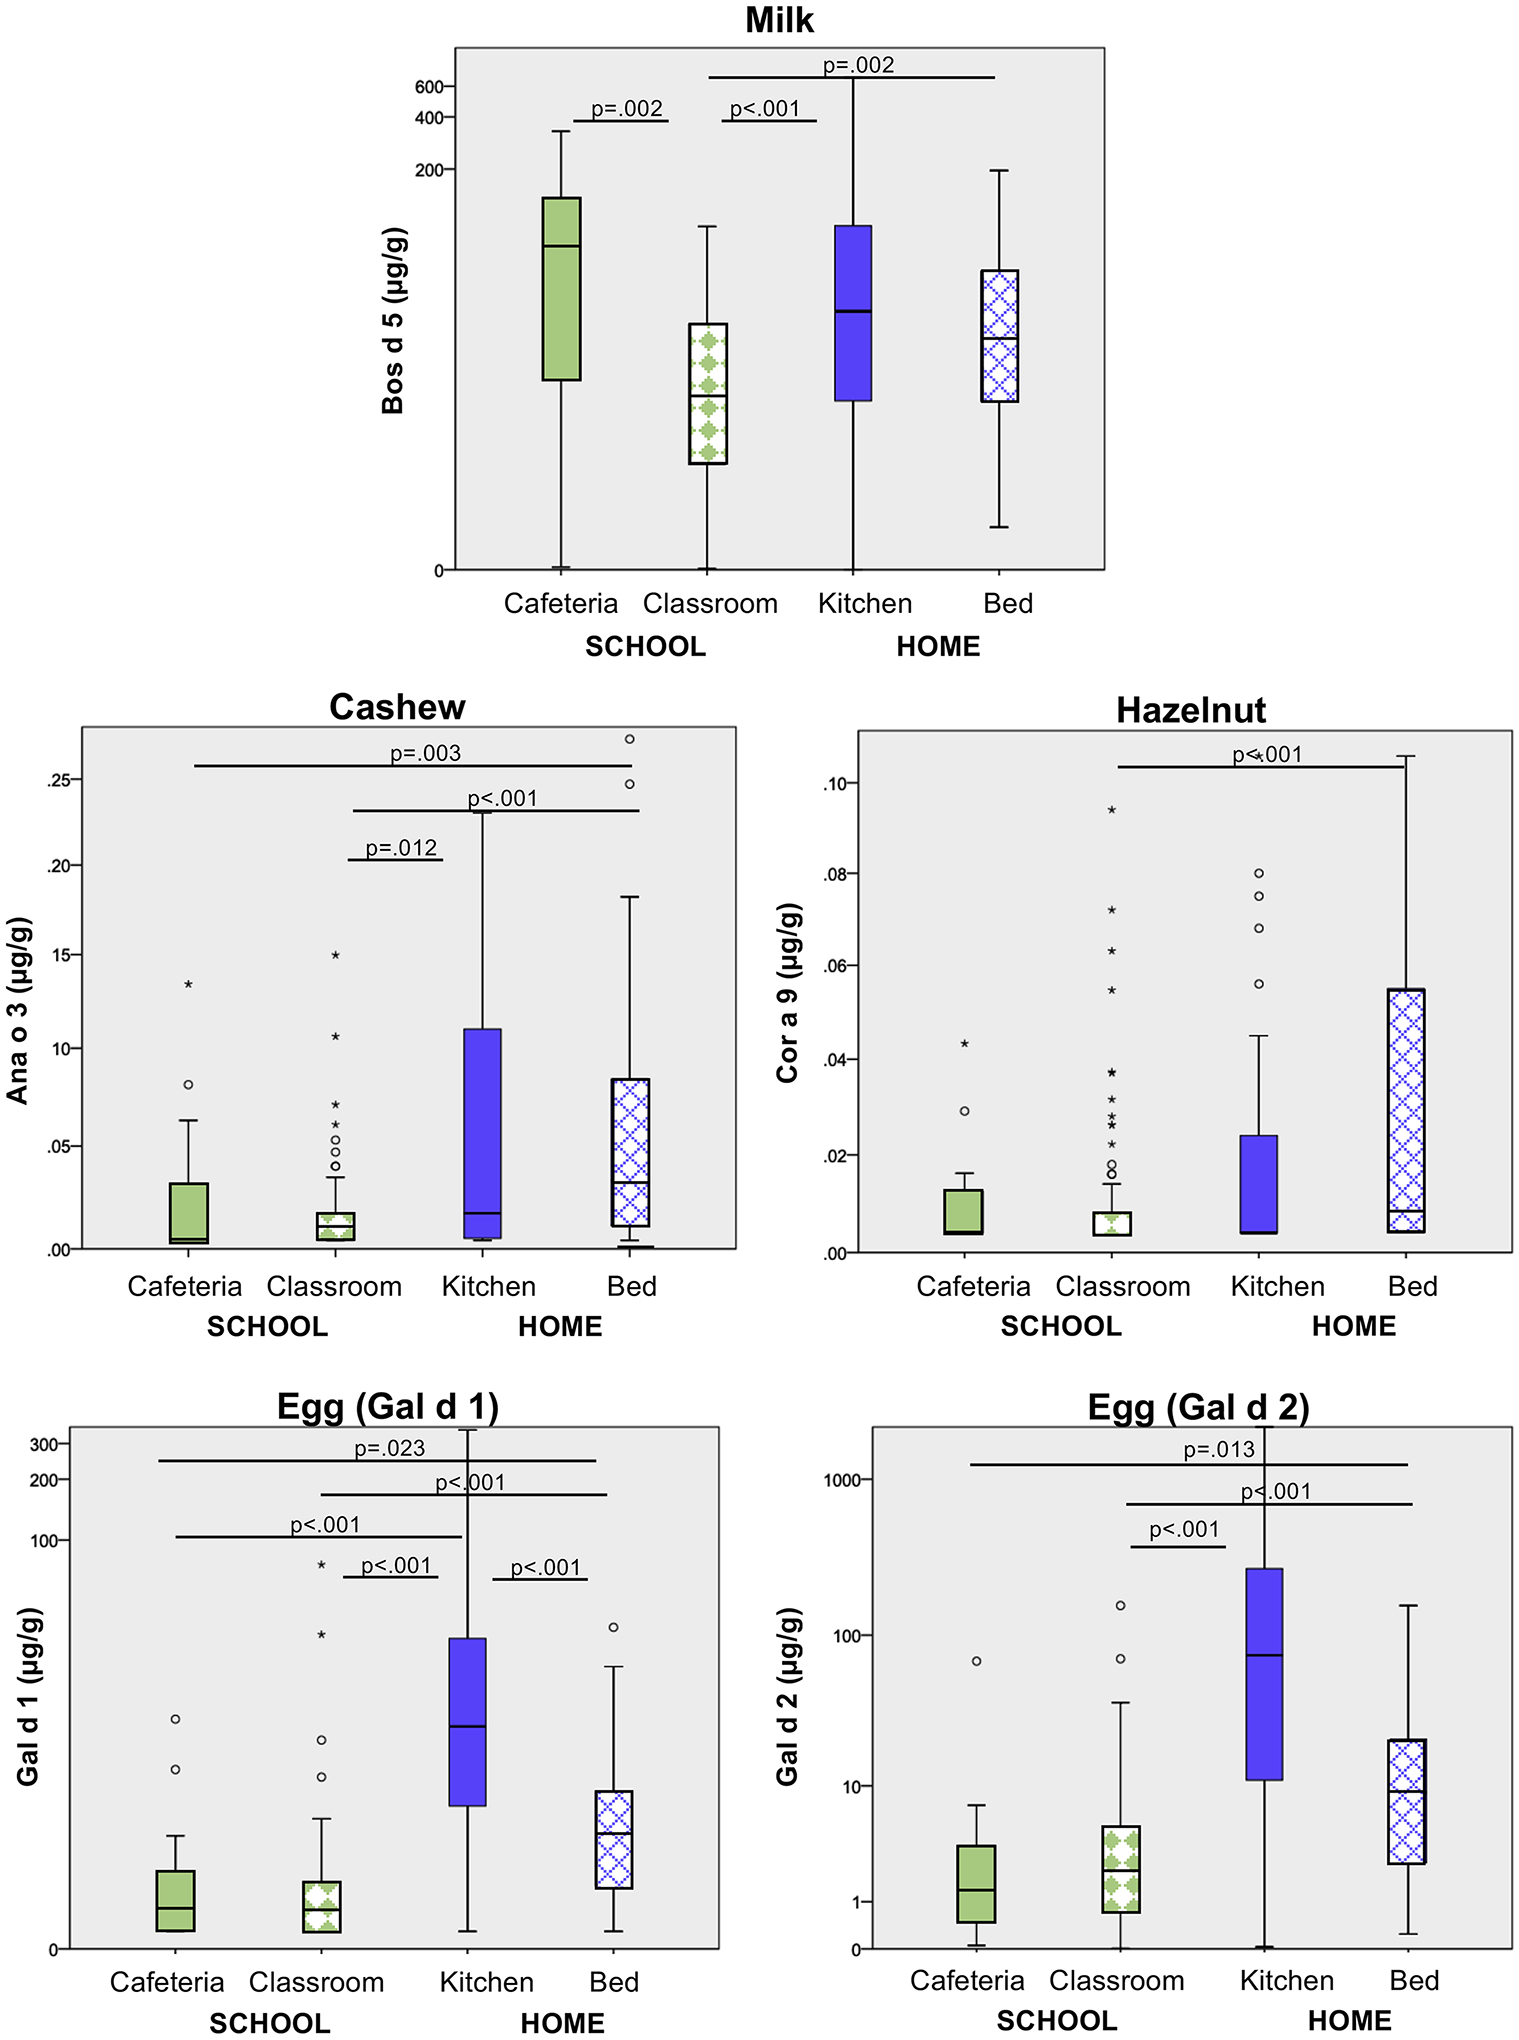
Figure 3: Food Allergen Levels Across Home and School Locations.

There were 98 school samples (16 cafeteria and 82 classroom) and 180 home samples (90 from the kitchen and bed, respectively). Only significant differences shown. For each of the allergens, the distribution of food allergen detected from homes was significantly higher than the schools (p<0.001 for all). Pairwise comparison by Mann Whitney U test.
