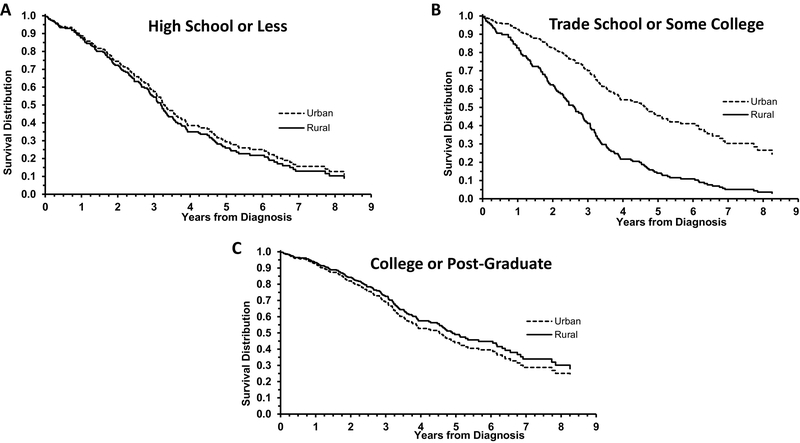
Figure 2:
Illustration of the survival distribution of high-grade ovarian cancer patients based on the fitted Cox proportional hazard regression model comparing urban vs. rural survival by education level (2A: high school or less; 2B: trade school/some college; 2C: college/postgraduate) with their clinical and demographic characteristics set to the most frequently occurring levels in the study population and age and BMI set at study mean values: stage=advanced, cytoreduction=optimal, histology=serous, comorbidities=none, age=61.0, BMI=29, site=Iowa, married/with partner.

