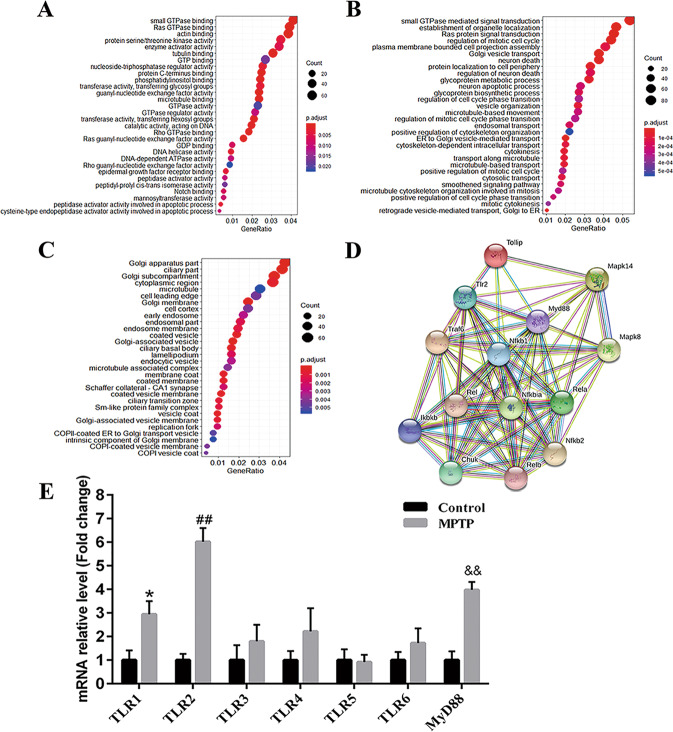
Fig. 3. RNA-sequencing analysis of sciatic nerves showing TLRs implicated with PD peripheral neuropathy.
A GO molecular function analysis. B GO biological process analysis. C GO cell composition analysis. D Related genes in TLRs signaling pathway. E qPCR validation. Data were presented as mean ± SEM and analyzed by one-way ANOVA followed by Tukey’s post hoc test for Fig. 3A–C; n = 4. Data in Fig. 3E were analyzed by Student’s t-test; n = 6. *p < 0.05, ##p < 0.01, and &&p < 0.01 vs. saline group. MPTP: 1-methyl-4-phenyl-1,2,3,6-tetrahydropyridine; GO: Gene Ontology; qPCR: quantitative real-time polymerase chain reaction; TLR: toll-like-receptor; TLRs: toll-like receptors; MyD88: myeloid differentiation-factor 88; SEM: standard error of the mean; ANOVA: analysis of variance.

