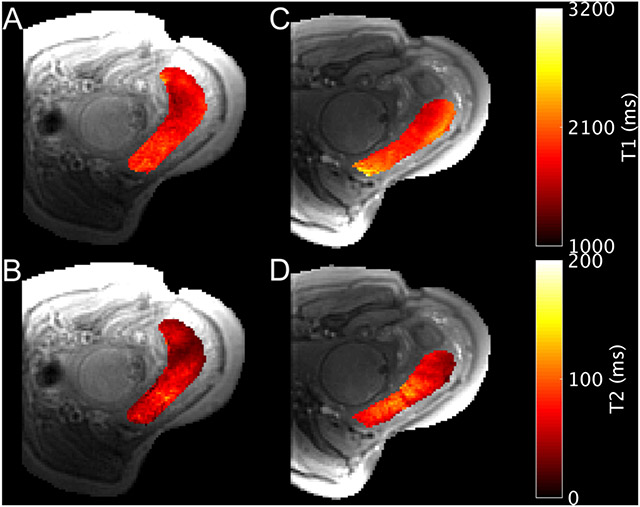
Figure 4.
Example T1 (A, C) and T2 (B, D) parameter maps during normoxia (A, B) and hyperoxia (C, D) for the placenta of subject 31 (31w4d). Acquisition was in the transverse plane while the subject was in the left lateral position. The imaging plane shifted due to maternal and fetal motion between normoxia and hyperoxia.

