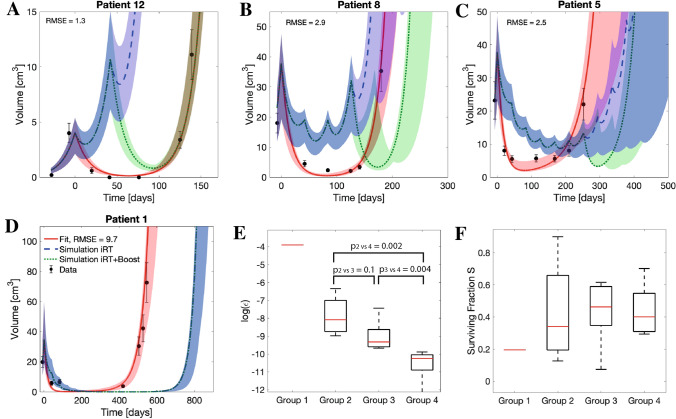
Figure 5.
Grouping of patient response. (A–D) Estimated growth trajectories of representative patients for fitted HFSRT (red), and simulated iRT (blue) and iRT + boost (green) treatments with up to eleven treatment fractions. Shaded areas correspond to the envelope of the bootstrap estimated modeling uncertainty. (A) Group 1, (B) Group 2, (C) Group 3, (D) Group 4. (E) Analysis of the logarithm of the decay rate for the different groups. Indicated p-values correspond to Wilcoxon signed rank tests between the groups comprising more than one patient. (F) Analysis of the radiotherapy surviving fraction for the different groups. There were no significant differences. In (E) and (F) median values (red lines), 25th and 75th percentiles (box upper and lower bounds) and full ranges (whiskers) are shown.

