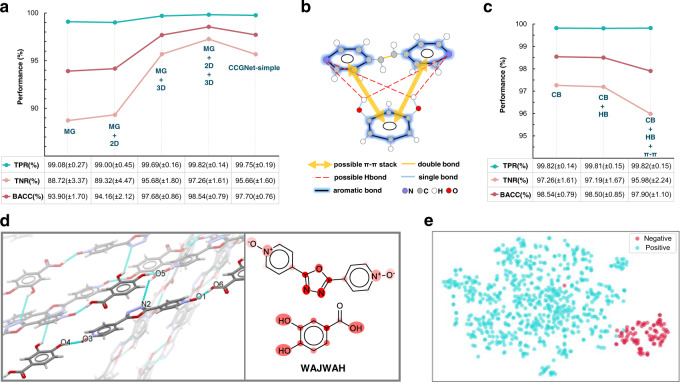
Fig. 2. Ablation experiments on feature representation and model architecture.
a Prediction performance for the network trained with different subsets of features and different concatenation ways for the tenfold cross-validation set. MG denotes only using Molecular Graph as input. MG + 2D denotes a combination of MG and the 2D descriptors while MG + 3D means a combination of MG and the 3D descriptors. MG + 2D + 3D represents the complementary input of MG, 2D, and 3D descriptors. CCGNet-simple denotes that the concatenation operation in each CCGBlock is removed, only retaining the concatenation at the readout phase. CCGNet-simple also uses the combination of MG, 2D and 3D descriptors as input. TPR, TNR, and BACC denote true positive rate, true negative rate and balanced accuracy (see Methods for details), respectively. b Illustration of two possible intermolecular interactions as new edge features for the molecular graph. The red dashes denote possible H-bonding (HB) and the yellow arrows represent the possible π–π stack (π–π). c Model performances of CCGNet trained with different edge representations for the tenfold cross-validation set. CB: the complementary features composed of the 12 molecular descriptors and the molecular graph only involving the covalent bond as the edge feature. CB + HB: introduction of the intermolecular H-bonding (HB) into the molecular graph of CB. CB + HB + π–π: adding HB and the intermolecular π–π interaction (π–π) into the molecular graph of CB. d Attention visualization for one representative cocrystal involving the intermolecular H-bonding and π–π interaction. The real co-crystal structure displayed by Mercury and the 2D structure is highlighted by the attention weights. The redder the color, the greater the attention weight. The cyan dash line denotes the intermolecular H-bonding. e t-SNE analysis on one representative fold of the tenfold cross-validation for CCGNet. Hidden representations are extracted after the concatenation operation in the readout phase. Red: Negative sample. Blue: Positive sample.

