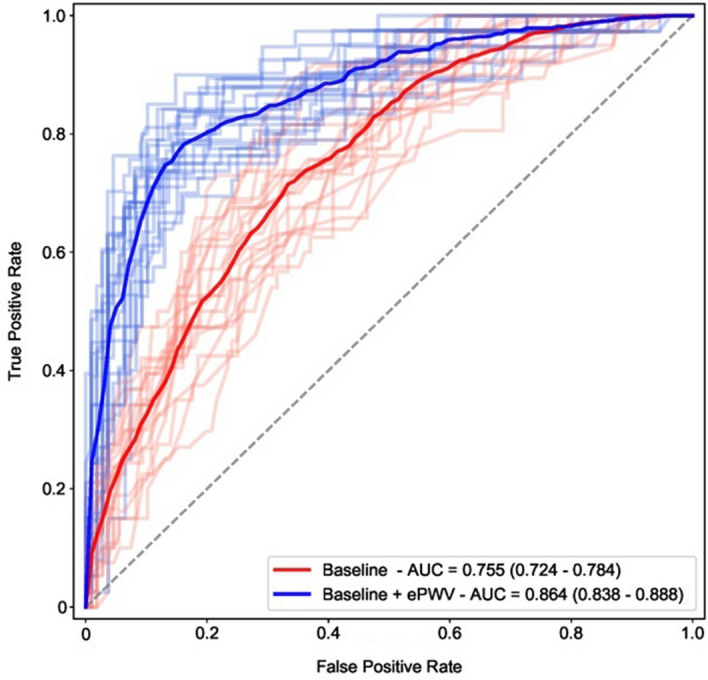
Figure 2.

Receiver Operating Characteristic (ROC) curves and corresponding areas under the ROC curve for ePWV on top of the baseline model with respect to 28-day death. Areas under the curve were derived from an appropriate test set (20% of the total sample) after 1,000 bootstrap replicates and training of the boost gradient algorithm on the remaining 80% of the population (training set). Baseline model included age, sex, history of hypertension, DM, CKD, CVD, lung disease and active cancer. To enhance visual clarity a limited number of bootstrapped ROC curves are provided in pale colors as opposed to intense blue and red average estimates. AUC: area under the curve, CKD: chronic kidney disease, DM: diabetes mellitus, CVD: cardiovascular disease including history of coronary artery disease and/or heart failure, ePWV: estimated pulse wave velocity.
