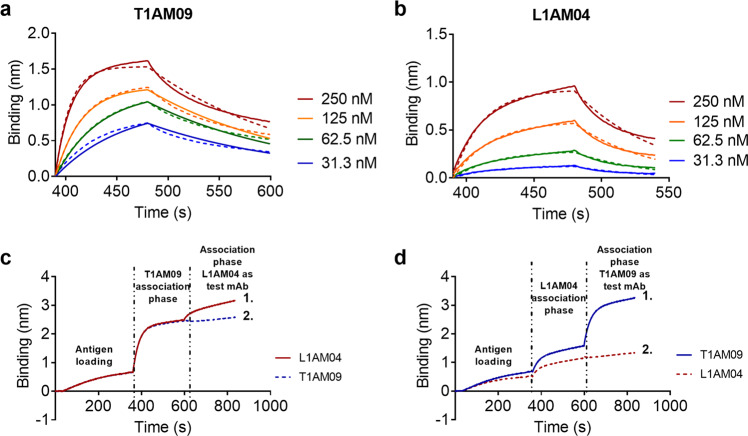
Fig. 4. Bio-Layer Interferometry (BLI) and epitope binning quantitate affinity of mAbs to AM.
Binding curve of a T1AM09, and b L1AM04, generated by BLI - solid lines represent experimental data and dashed lines are statistically fitted curves. Two-phase binding experiment assessing c T1AM09 and d L1AM04 competition with each other. Solid line 1 shows the association curve with test mAb. Dashed line 2 is the association curve with self-control. .

