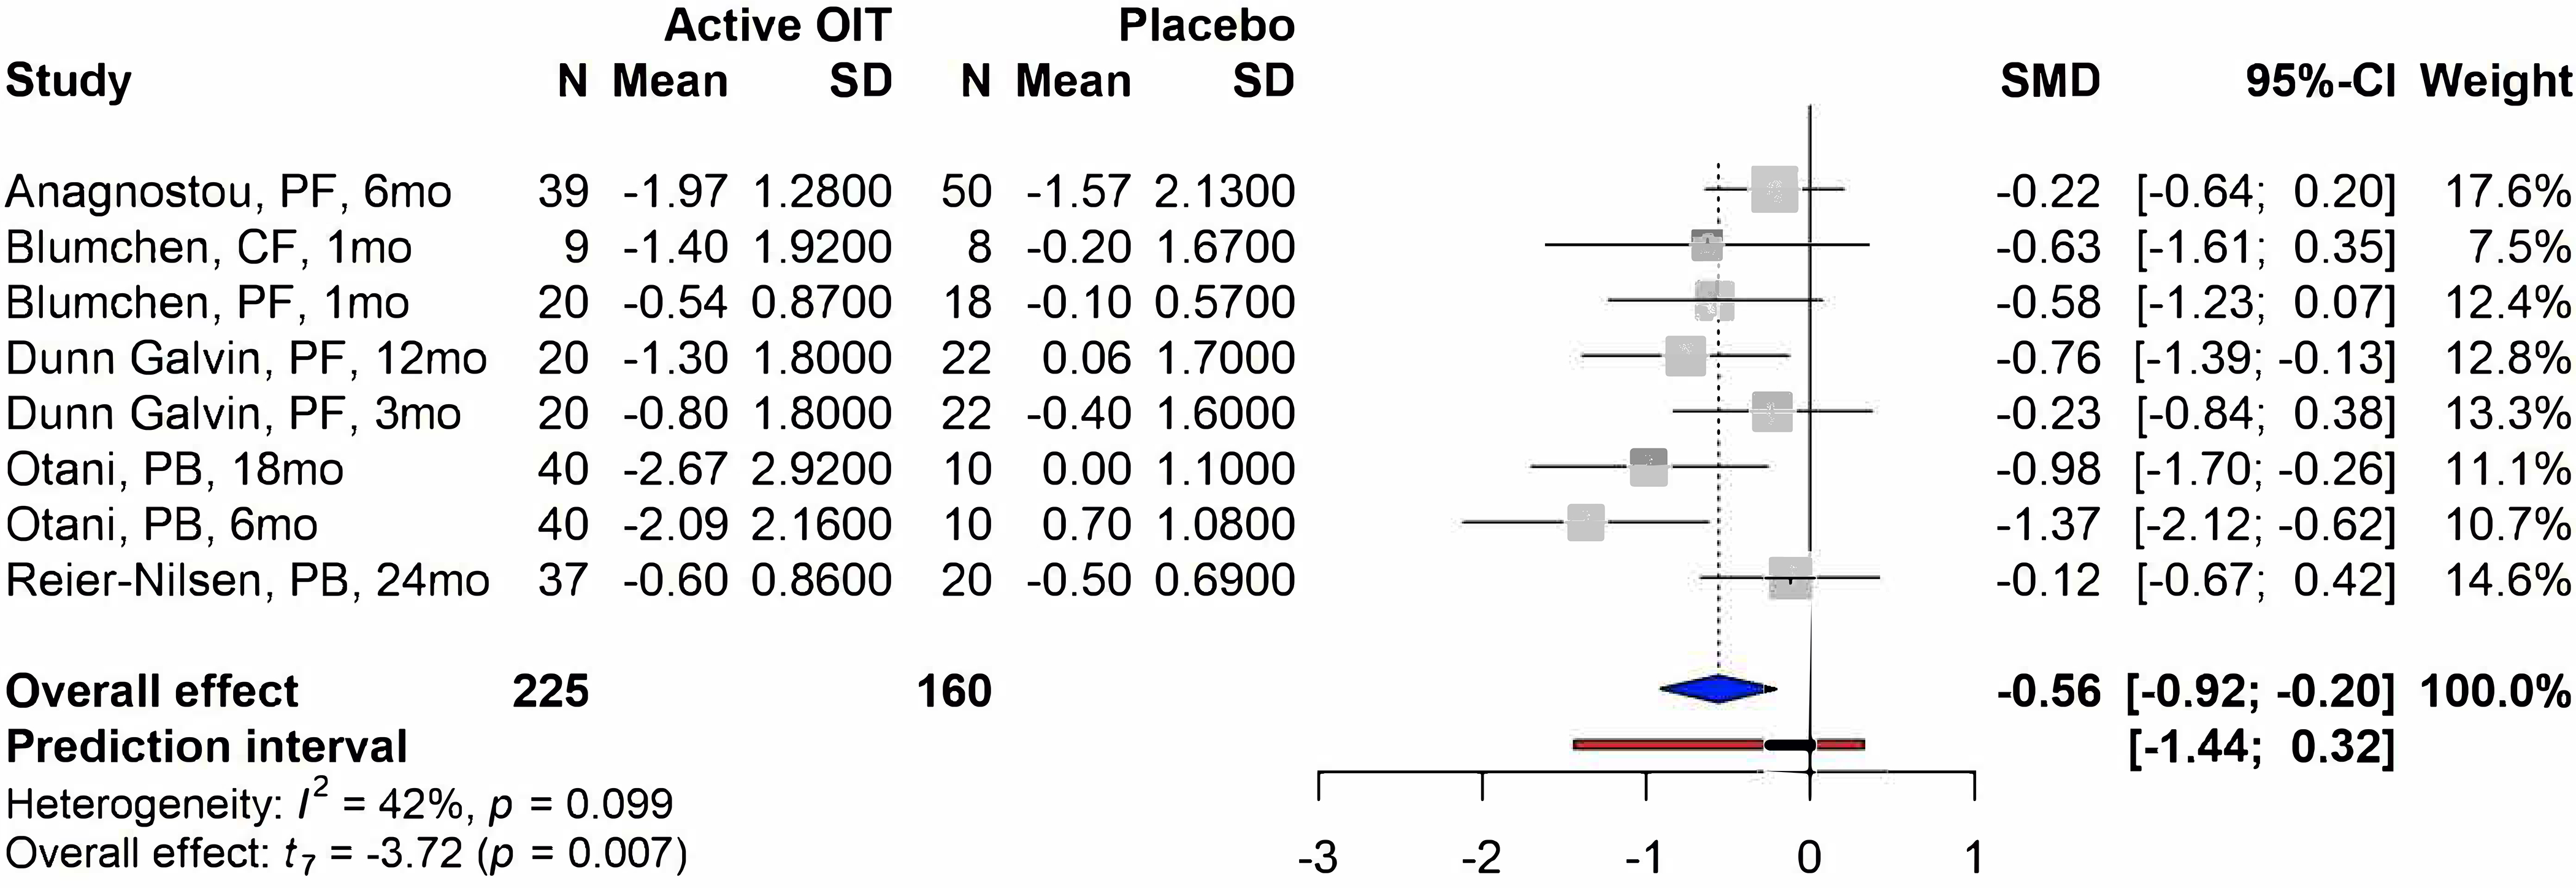
Figure 3. Forest plot of meta-analysis for studies comparing active OIT group and placebo group.

Study label includes first author’s last name, questionnaire forms, and follow-up time in months/weeks. PF=parental form, CF=child form, PB=parental burden form, SD=standard deviation, SMD=standardized mean difference.
