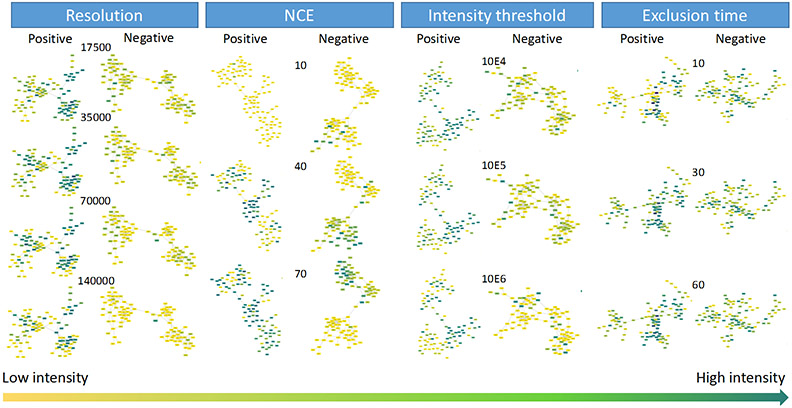
Figure 3.
The intensity of the largest cluster in each MN under different parameter settings using liquid BRB extract. Colors represent the signal intensity of the node. The darker the color, the stronger the signal intensity. The color distribution in these clusters represents the relationship between signal intensity of nodes and parameter changes.

