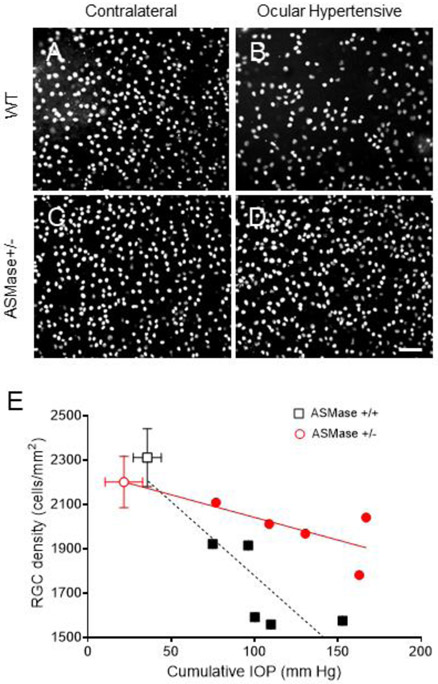
Figure 6. Increased survival of RGCs in ASMase+/− mice with increased IOP.
Representative photograph of Brn3a-labeled retinal ganglion cells in the peripheral mouse retinas. (A) WT control eyes; (B) WT ocular hypertensive eyes; (C) ASMase+/− control eyes and (D) ASMase+/− ocular hypertensive eyes. Scale bar, 50 μm. (E) Correlation of cumulative ΔIOP for 28 days with RGC density in WT (squares) and ASMase+/− mice (circles). Contralateral WT (open square) and ASMase+/− eyes (open circle) are presented as averages. Ocular hypertensive WT eyes (closed square) and ASMase+/− eyes (closed circle) are presented individually. Data are expressed as mean ± SEM. Statistical analysis was performed using unpaired two tailed t test.

