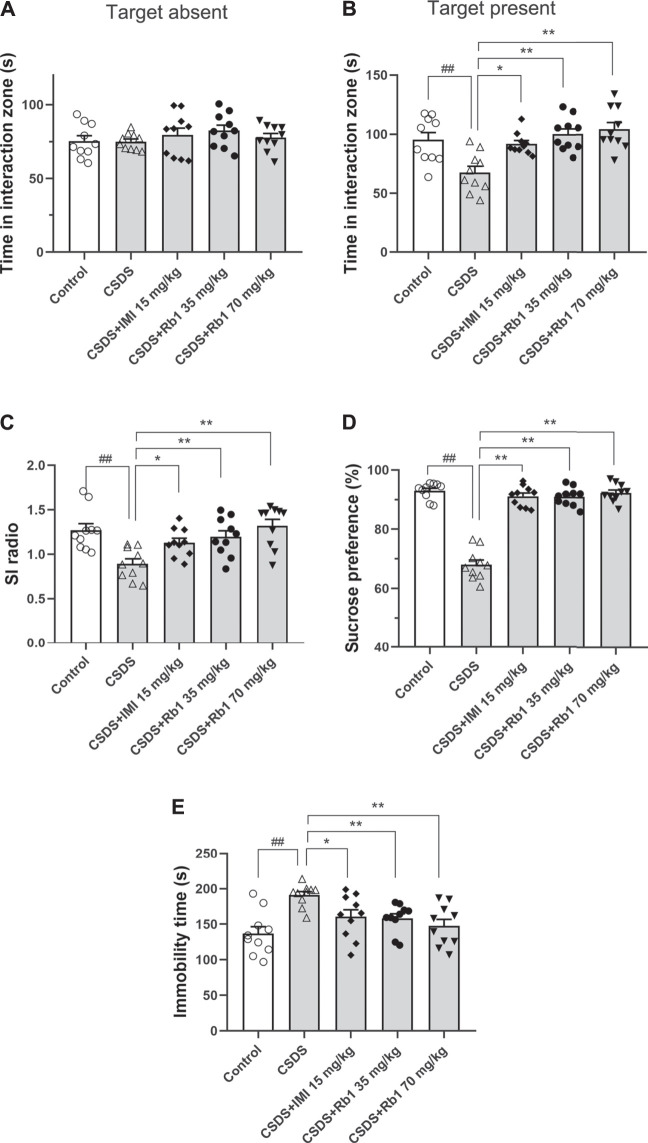
FIGURE 2.
Rb1 exerted antidepressant-like effects in a CSDS-induced depression model (A–C) The time spent in the social IZ and the SI ratio in the SIT. (D) The intake of sucrose (in percentage) in the SPT. (E) Immobility time in the FST. N = 10 in each group; the data are presented as the mean ± S.E.M. ## p < 0.01, vs. the control group; * p < 0.05, **p < 0.01, vs. the group exposed to CSDS; one-way ANOVA.

