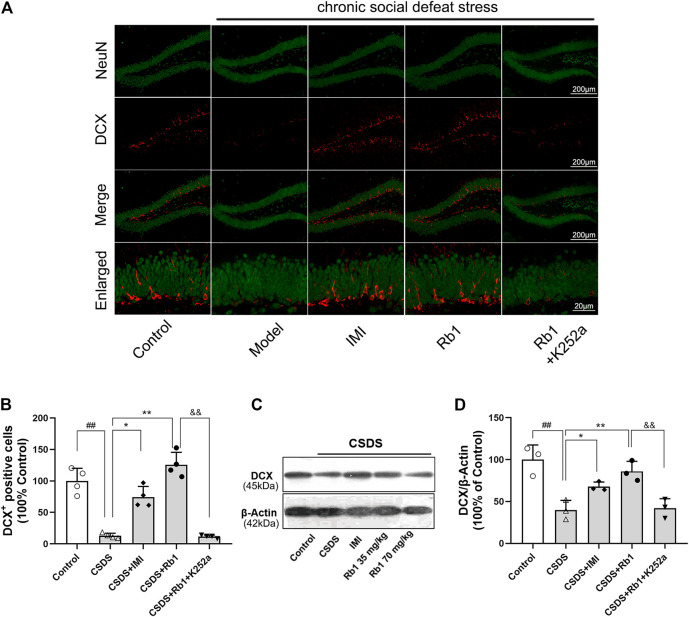
FIGURE 6.
Impact of pretreatment with K252a on the number of DCX-positive cells (Rb1-induced) in CSDS. (A) Representative immunofluorescence images of the dentate gyrus (DG) and costaining of the neuronal nuclear protein (NeuN) and DCX in green color. The scale bar is 200 and 20 μm for the representative and the enlarged images, accordingly. (B) The number of DCX + cells in the DG. (C–D) Represents immunoblotting of DCX coincided with immunohistochemical changes. N = 3–4 per group; the obtained data have been depicted as mean ± S.E.M. # p < 0.05, ## p < 0.01, vs. the control group; * p < 0.05, **p < 0.01, vs. the model group.

