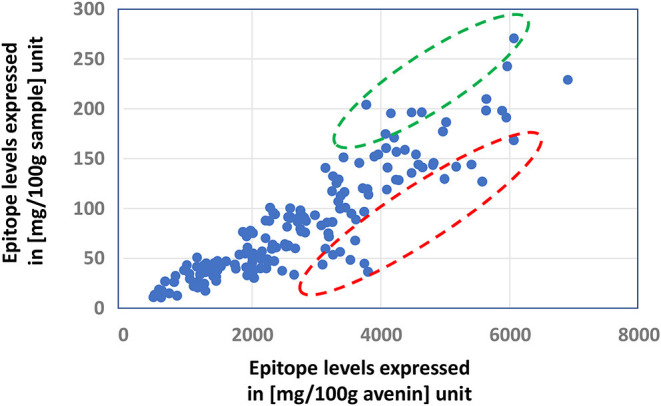
Figure 2.

Demonstrating the importance of expression levels of avenin and non-avenin proteins in the ranking of relative celiac epitope amounts of oat samples by the comparison of ranking samples based on the amount of celiac-related epitopes expressed in (mg/100 g avenin) and (mg/100 g sample) units. Relative celiac-related epitope levels in samples in the red circle are largely underestimated by the simple comparisons of the epitope levels in the samples, not taking into account the total protein content and its avenin content. Circled data with red and green indicate under- and overestimated epitope levels using [mg/100 g avenin] units, respectively, not considering the contribution of protein content and avenin content of the sample.
