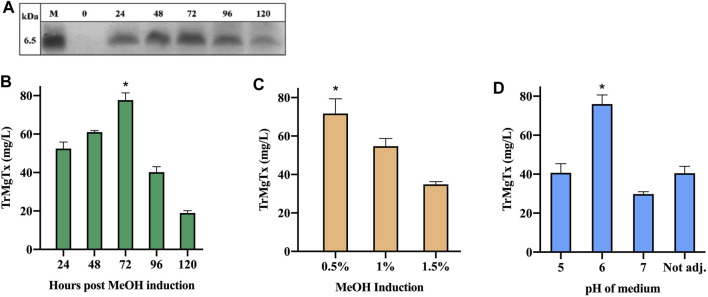
FIGURE 2.
Optimization of TrMgTx expression in shake-flask fermentation. (A) 15 µl of supernatant samples were collected at indicated time points and analyzed by using 16% tricine–SDS-PAGE (stained with R-250 CBB). The samples from 24 to 120 h show bands of ∼6.5 kDa (close to the estimated MW of TrMgTx). (B) Concentration of TrMgTx in supernatant was quantified at the indicated time points by comparing the gel band intensity of TrMgTx with that of the standards by using Image Lab software (Bio-Rad). Expression was induced by 0.5% methanol at pH = 6.0 of the medium. (C) Secretion of TrMgTx in culture (at pH 6) induced with different MeOH concentrations for 72 h, peptide concentration was determined as in (A). (D) TrMgTx expression was determined as in (A) when induced with 0.5% MeOH for 72 h at the indicated pH values of the medium. Label “Not adj.” means that the pH of the medium was not buffered. Data represent the mean of three independent experiments, where the error bars are SEM. Asterisks indicate significant difference in all pairwise multiple comparison (Tukey's test), *p < 0.05.

