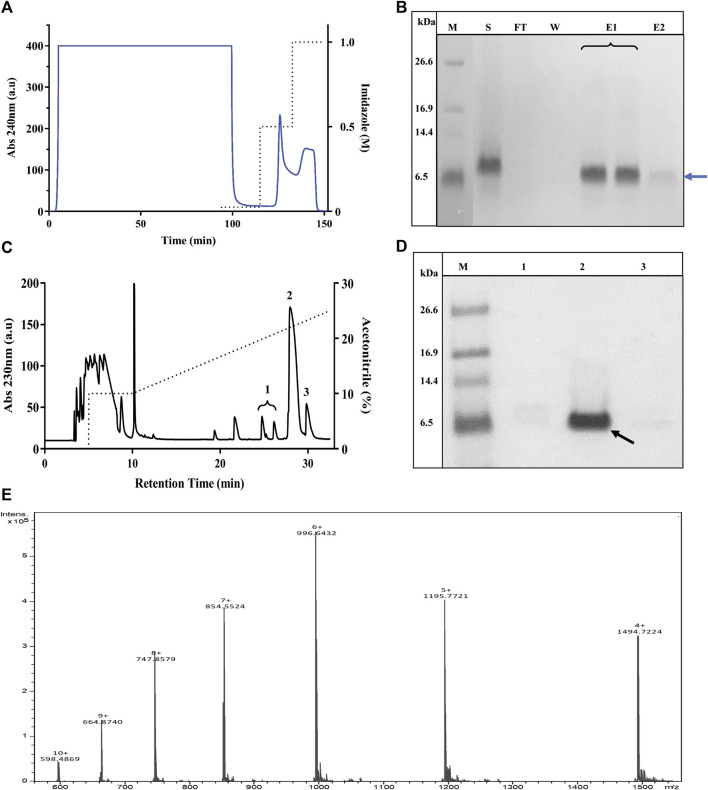
FIGURE 3.
Purification of TrMgTx. (A) The chromatogram shows the loading of the supernatant of P. pastoris culture (cultured for 72 h, pH 6, induced with 0.5% MeOH) on a Ni2+ affinity column and elution with imidazole in isocratic mode. Absorbance was measured at 240 nm (indicated with blue line, left axis) and dotted line denotes the concentration of imidazole in elution buffer (right axis). (B) 16% Tricine–SDS-PAGE illustrates the analysis of fractions collected from Ni2+ affinity chromatography, where lane labels stand for M: low-molecular-weight (LMW) protein marker, S: raw (unpurified) supernatant, FT: flow through, W: wash with washing buffer, E1: elution with 0.5 M imidazole, and E2: elution with 1 M imidazole. A band at 6.5 kDa position (blue arrow) in lane E1 and E2 represents partially purified TrMgTx. (C) RP-HPLC chromatogram of TrMgTx. Partially purified TrMgTx in step 1 (A,B) was applied on RP-HPLC C18 semi-prep column and eluted with a gradient of 10–30% acetonitrile (shown with dotted line, right axis) over 30 min. Absorbance was recorded at 230 nm (left axis). Numbers indicate the peaks collected. (D) 16% Tricine–SDS-PAGE analysis of fractions collected from the RP-HPLC column. Lanes represent M: LMW protein marker, 1–3: fractions from corresponding peaks as indicated in RP-HPLC chromatogram (panel C). The band of 6.5 kDa in lane 2 indicated with a black arrow represents purified TrMgTx. (E) ESI-QTOF-MS spectrum shows the average mass (5980.86 Da) of purified TrMgTx.

