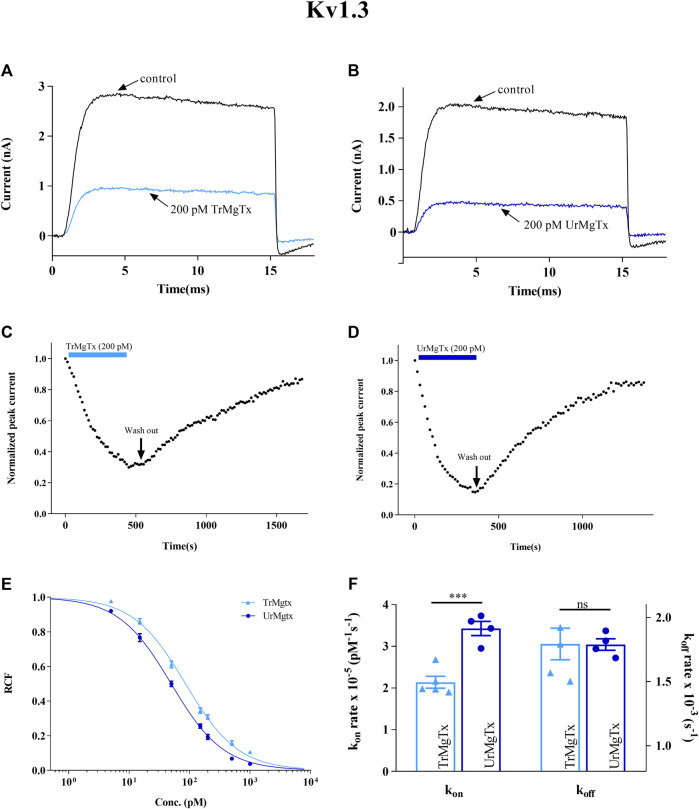
FIGURE 6.
Inhibition of hKv1.3 currents by tagged and untagged recombinant MgTx. (A,B) Whole-cell currents through hKv1.3 were evoked from activated human peripheral lymphocytes by depolarization to +50 mV from a holding potential −120 mV for 15 ms duration. Test pulses were applied every 15 s. Representative traces show the K+ current before the application of toxin (control) and after reaching the equilibrium block in the presence TrMgTx (A) or UrMgTx (B) at 200 pM concentration (as indicated). (C,D) Development of and recovery from the block of hKv1.3 current. Normalized peak currents were measured in whole-cell patch configuration and plotted against time as 200 pM of TrMgTx [(C), light blue bar] or UrMgTx [(D), dark blue bar] was applied to the bath solution. Following block equilibrium, the recording chamber was perfused with toxin-free solution (arrow, washout) to demonstrate reversibility of the block. (E) Concentration-dependent block of hKv1.3 by TrMgTx and UrMgTx. The RCF values taken at different toxin concentrations were fitted with a three-parameter (inhibition) vs response model (see the Materials and Methods section for details). The best fit resulted in K d = 50 pM for UrMgTx and K d = 86 pM for TrMgTx. Error bar represents SEM and n = 3–4. (F) Comparison of block kinetics of TrMgTx and UrMgTx for hKv1.3. Association rate constant k on (left y-axis) and dissociation rate constant k off (right y-axis) were calculated from measured time constants (τ on, τ off ) for the development of the block in the presence of 200 pM toxin and the washout (see panel C,D), assuming a simple bimolecular reaction between the channel and toxin (see the Materials and Methods section for details) and plotted on bar graph. Symbols indicate individual data points (n = 4); bar heights and error bars indicate mean ± SEM. ***p < 0.001, ns = not significant, unpaired t test.

