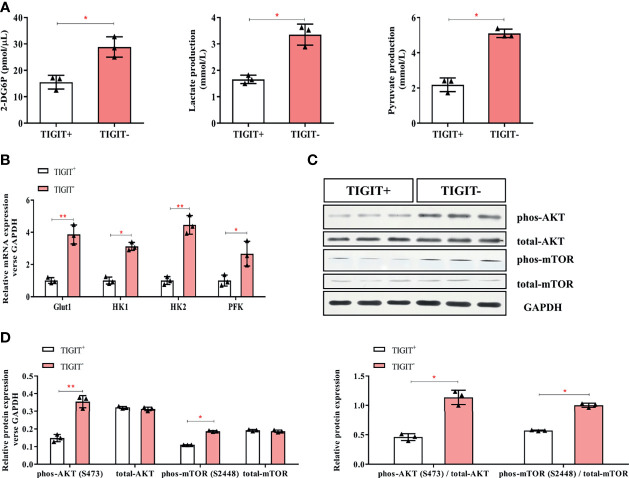
Figure 3.
Glycometabolism of TIGIT+CD3+ T cells is decreased in colorectal cancer patients. TIGIT+CD3+ T cells were sorted from PBMC of colorectal cancer patients. (A) The concentration of 2-DG6P, Lactate and Pyruvate was reduced in TIGIT+CD3+ T cells compared to TIGIT-CD3+ T cells. (B) Glut1, HK1, HK2, and PFK were measured by RT-PCR and mRNA expression was quantified. Glut1, HK1, HK2, and PFK elevated in TIGIT+CD3+ T cells. (C) Representative blots of western blotting were shown. (D) Western blotting analysis was performed to determine the phosphorylation levels of the AKT/mTOR pathway. The results were normalized to GAPDH expression and presented as relative protein expression. *P < 0.05; **P < 0.01.

