Figure 6.
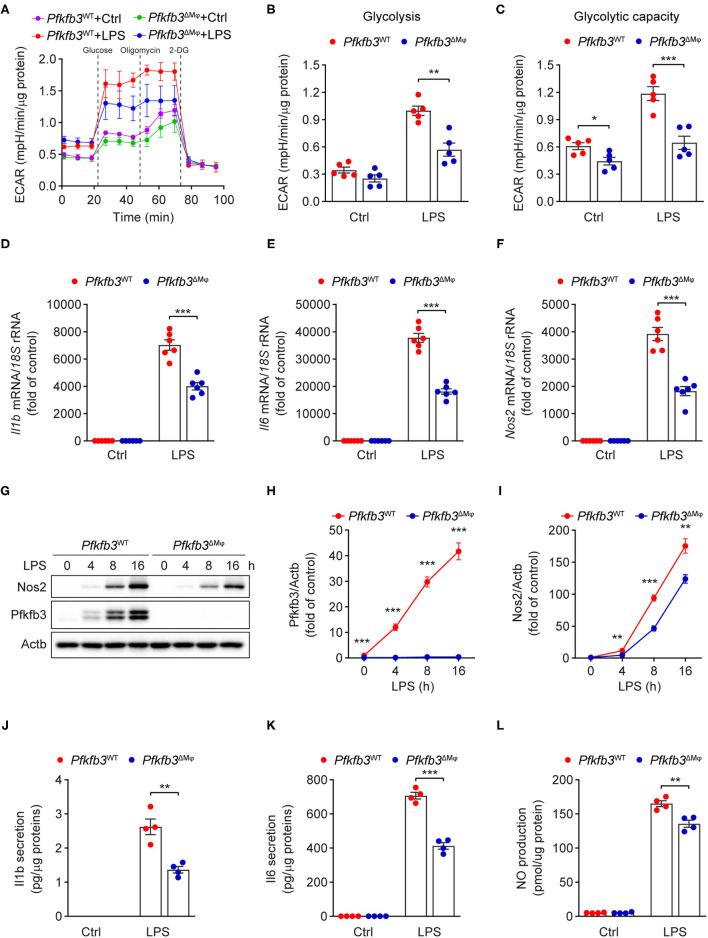
Enhance glycolysis in macrophages supports their proinflammatory activity upon LPS stimulation. (A) ECAR profile shows glycolytic function in Pfkfb3WT and Pfkfb3ΔMϕ BMDMs treated with LPS (100 ng/mL) for 6 h (n = 5). (B,C) Quantification of glycolysis [(B), ECAR after glucose addition and subtracted by the average of basal values] and glycolytic capacity [(C), ECAR after oligomycin addition and subtracted by the average of basal values] from (A) (n = 5). (D–F) qPCR analysis of the mRNA levels of Il1b (D), Il6 (E) and Nos2 (F) in Pfkfb3WT and Pfkfb3ΔMϕ BMDMs treated with LPS (100 ng/mL) for 4 h (n = 6). (G–I) Representative Western blot results of Nos2, Pfkfb3 and Actb in Pfkfb3WT and Pfkfb3ΔMϕ BMDMs treated with LPS (100 ng/mL) for the indicated times (G) and relative ratio of Pfkfb3/Actb (H) and Nos2/Actb (I) were quantitated by densitometric analysis of the corresponding Western blots (n = 4). (J,K) ELISA analysis of Il1b (J) and Il6 (K) secretion in the supernatants of Pfkfb3WT and Pfkfb3ΔMϕ BMDMs treated with LPS (100 ng/mL) for 16 h (n = 4). (L) Quantification of NO secretion in the supernatants of Pfkfb3WT and Pfkfb3ΔMϕ BMDMs treated with LPS (100 ng/mL) for 16 h (n = 4). All data are represented as mean ± SEM, **P < 0.01 and ***P < 0.001 for Pfkfb3WT vs. Pfkfb3ΔMϕ (unpaired two-tailed Student's t test).

