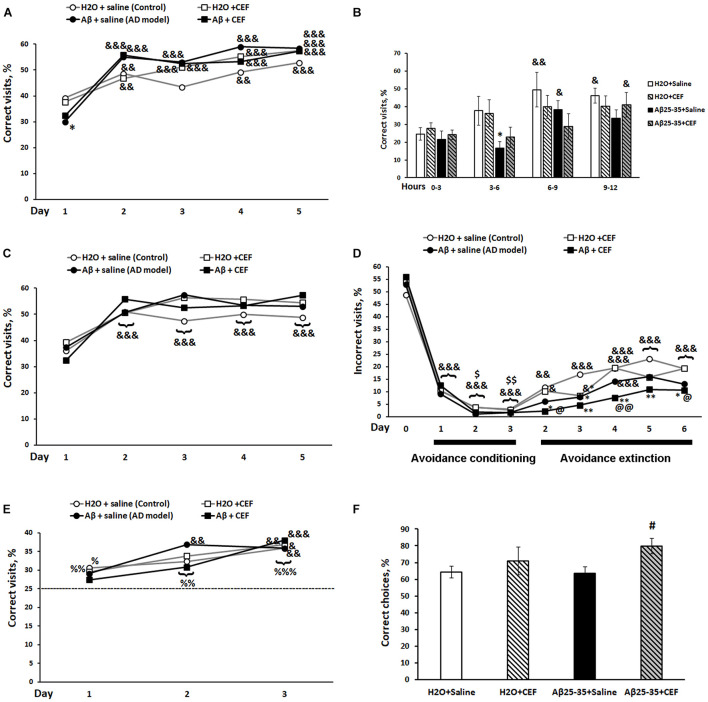
FIGURE 3.
Effects of the CEF and Aβ25–35 administration (AD model) on the place learning (A,B), place learning reversal (C), avoidance conditioning and extinction (D), patrolling behavior (E) in the IntelliCage, or on the working spatial memory in the T-maze test (F) in mice. The dynamics of place learning in the IntelliCage was evaluated during the whole period of the test with the values pooled daily (A) or during the first day of this phase of the test with the values pooled for 3 h (B). The data are expressed as means (A,C–E) or mean ± SEM (B,F) of the values obtained in an independent group of animals (n = 7–8 per group). Statistically significant differences: &p < 0.05, &&p < 0.01, &&&p < 0.001 compared with values of the same group at the first timepoint of the phase, for avoidance conditioning—compared with values of the same group on the last day of the previous phase (day 0 in the figure), for avoidance extinction—compared with values of the same group on the last day of the previous phase (day 3 of the avoidance conditioning test); $p < 0.05, $$p < 0.01 compared with values of the same group on the first day of the avoidance conditioning test; %p < 0.05, %%p < 0.01, %%%p < 0.001 compared with the chance level (25%); ∗p < 0.05, ∗∗p < 0.01 compared with respective values of the “H2O + saline” group; #p < 0.05 compared with respective values of the “Aβ + saline” group; @p < 0.05, @@p < 0.01 compared with respective values of the “H2O + CEF” group.

