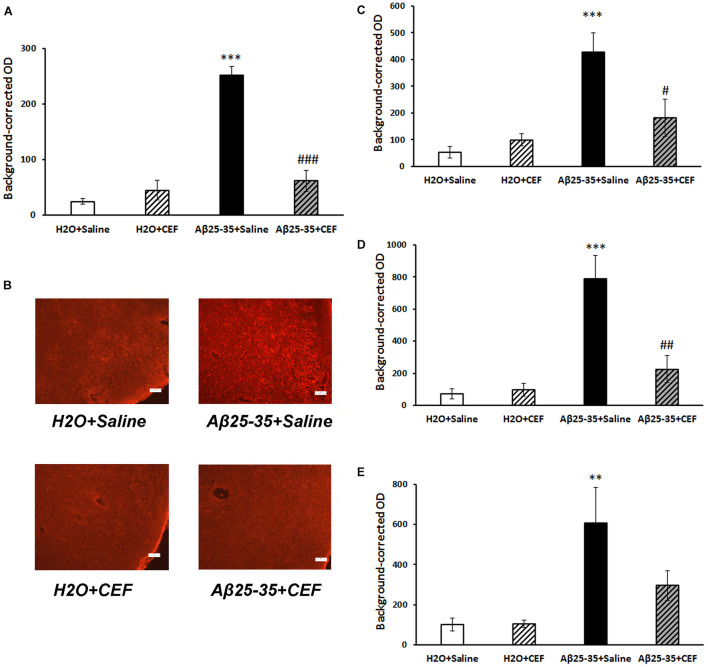
FIGURE 4.
Effects of the CEF and Aβ25–35 administration (AD model) on the Aβ accumulation in the frontal cortex (A,B) or hippocampus (C in the CA1 area; D in the CA3 area; E in the dentate gyrus) in mice. (A,C–E) Quantitative results. The data are expressed as mean ± SEM of the values obtained in an independent group of animals (n = 3–4 per group). Statistically significant differences: ∗∗p < 0.01, ∗∗∗p < 0.001 vs. the “H2O + saline” group; #p < 0.05, ##p < 0.01, ###p < 0.001 vs. the “Aβ + saline” group. (B) Aβ immunoreactivity in the frontal cortex. Magnification, ×200; bar, 50 μm.

