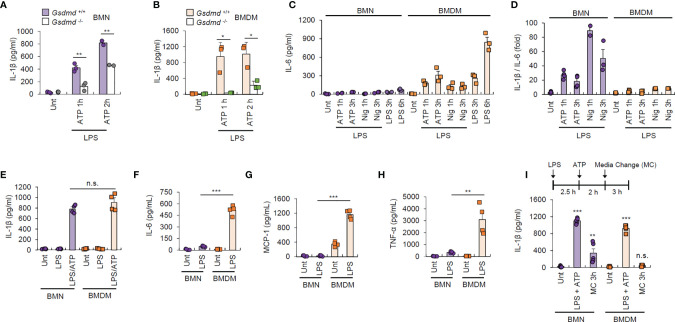
Figure 5.
Neutrophils exhibit unique IL-1β-oriented cytokine production. (A, B) Quantification of IL-1β in the culture supernatant of Gsdmd +/+ or Gsdmd -/- mouse BMNs (A) or BMDMs (B) treated with LPS (0.25 μg/mL, 2.5 h) followed by ATP (2.5 mM, 1 or 2 h) treatment (n = 3). (C, D) Quantification of IL-6 (C) or the relative IL-1β/IL-6 ratio (D) in the culture supernatant of mouse BMNs or BMDMs primed with LPS (0.25 μg/mL, 2.5 h), washed and treated with ATP (2.5 mM) or nigericin (5 μM) for 1 or 3 h, or treated with LPS alone (n = 3). (E) Quantification of IL-1β in the culture supernatant of mouse BMNs or BMDMs primed with LPS (0.25 μg/mL, 2.5 h) followed by ATP (2.5 mM, 1 h) treatment (n = 4). (F–H) Quantification of IL-6 (F), MCP-1 (G), and TNF-α (H) in the culture supernatant of mouse BMNs or BMDMs treated with LPS (0.25 μg/mL, 3 h) (n = 4). (I) Quantification of IL-1β in the culture supernatant of mouse BMNs or BMDMs treated with LPS (0.25 μg/mL, 2.5 h) followed by ATP (2.5 mM, 2 h) treatment, washed and incubated for 3 h in the presence of additional LPS and ATP (n = 5). Culture supernatants (Sup) or cell lysates (Lys) were immunoblotted with the indicated antibodies. *P < 0.05, **P < 0.01, ***P < 0.001, n.s. not significant.

