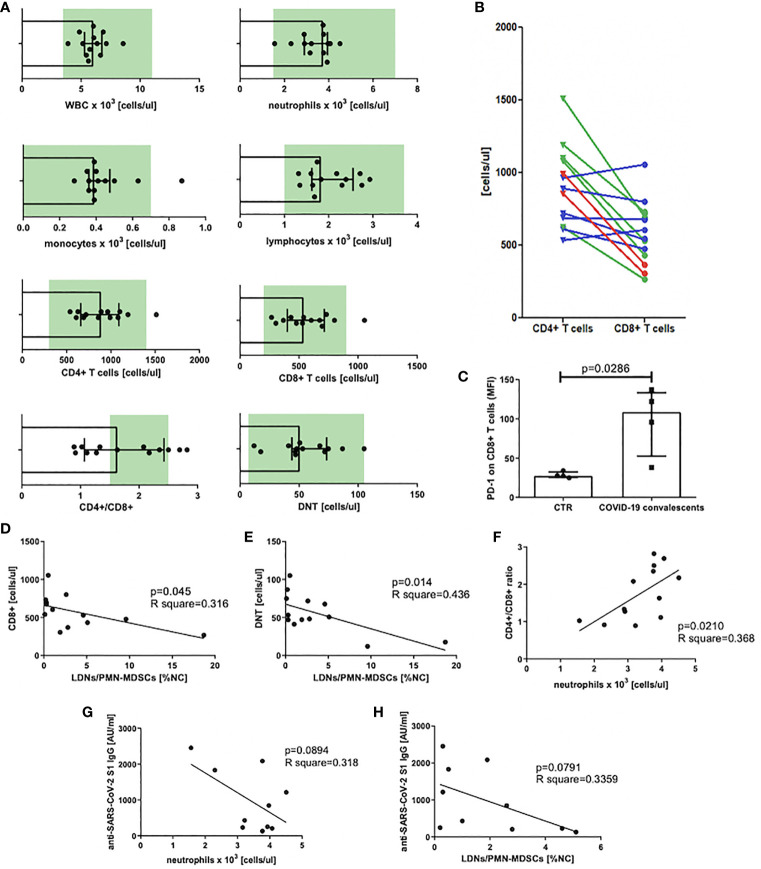
Figure 2.
(A) Blood WBC, leukocyte populations, and T–cell subset count in peripheral blood of COVID–19 convalescents with normal range marked in green. Normal range for DNTs was calculated from T cells [1%–5% of T cells, (38)] (n = 13). (B) CD4+ and CD8+ T–cell distribution in individual patients. Patients with CD4+/CD8+ ratio above the normal range are marked in red, within the norm in green, and below the norm in blue (n = 13). (C) PD–1 expression on CD8+ T cells of COVID–19 convalescents. Expression of PD–1 on CD8+ T cells of COVID–19 convalescent and healthy controls was evaluated by flow cytometry and presented as mean fluorescent intensity (MFI). Data from four subjects in each group are presented (n = 4). (D) Correlation of the level of LDNs/PMN–MDSCs and the count of CD8+ in blood of COVID–19 convalescents. CD8+ T cells were identified by flow cytometry as CD45+CD3+CD8+ cells and their concentrations were calculated from the total lymphocyte counts (n = 13). (E) Correlation of the level of LDNs/PMN–MDSCs and the count of double–negative T cells (DNT) in blood of COVID–19 convalescents. Double–negative T cells (DNTs) were identified by flow cytometry as CD45+CD3+CD4–CD8– and their concentrations were calculated from the total lymphocyte counts (n = 13). (F) Correlation of CD4+/CD8+ T cell ratio with neutrophil count in blood of COVID–19 convalescents (n = 13). (G) Correlation of anti SARS– CoV–2 S1 IgG antibody concentration with the number of neutrophils in COVID–19 convalescents (n = 10). (H) Correlation of anti–SARS CoV–2 S1 IgG antibody concentration with the frequency of LDNs/PMN–MDSCs in COVID–19 convalescents (n = 10).

