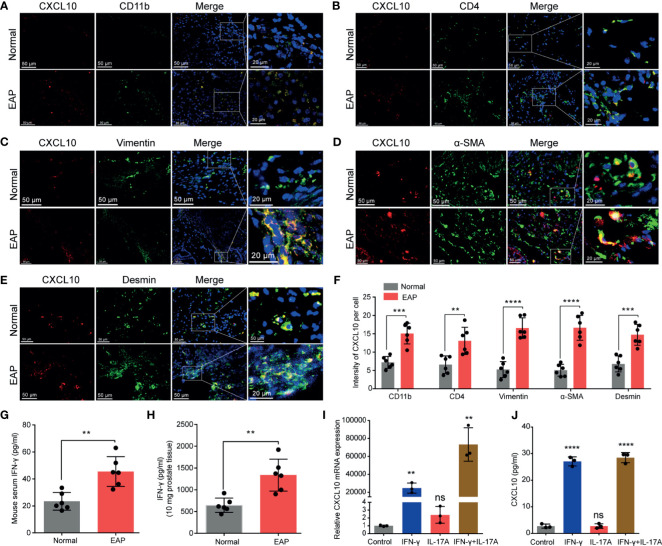
Figure 2.
The potential source of CXCL10 in the prostate of EAP mice. Representative photographs of immunofluorescence staining for CXCL10 and markers for CD4+ T cells (A), macrophages (B), and prostatic stromal cells (C–E) in the prostate of EAP mice. (F) Quantification of CXCL10 immunofluorescence intensity in the experiments of (A–E). High-expressed levels of IFN-γ in the serum (G) and prostate (H) in EAP mice. The expression levels of CXCL10 in WPMY-1 cells were evaluated with RT-qPCR (I) and ELISA (J) when treated with IFN-γ, IL-17A, and IFN-γ and IL-17A. Data are shown as mean ± SD by unpaired, two-tailed Student’s t-test analysis (F–H), or one-way ANOVA analysis (I, J). “ns” indicates P > 0.05; **P < 0.01; ***P < 0.001; ****P < 0.0001.

